BenQ E2200HD and E2400HD - 1080P FullHD LCDs
by Jarred Walton on November 4, 2008 5:00 AM EST- Posted in
- Displays
Brightness and Contrast Ratio
For the brightness (luminance), contrast, and color accuracy tests, we depend on a hardware colorimeter and software to help calibrate the displays. We use a Monaco Optix XR (DTP-94) colorimeter and Monaco Optix XR Pro software, and we also test with ColorEyes Display Pro. Results in nearly every case have been better with Monaco Optix XR Pro, so we only report the ColorEyes Display Pro results on the monitor evaluation pages. We'll start with a look at the range of brightness and contrast at the default LCD settings while changing just the brightness level. (In some cases, it will be necessary to reduce the color levels if you want to achieve a more reasonable brightness setting of 100-120 nits.)
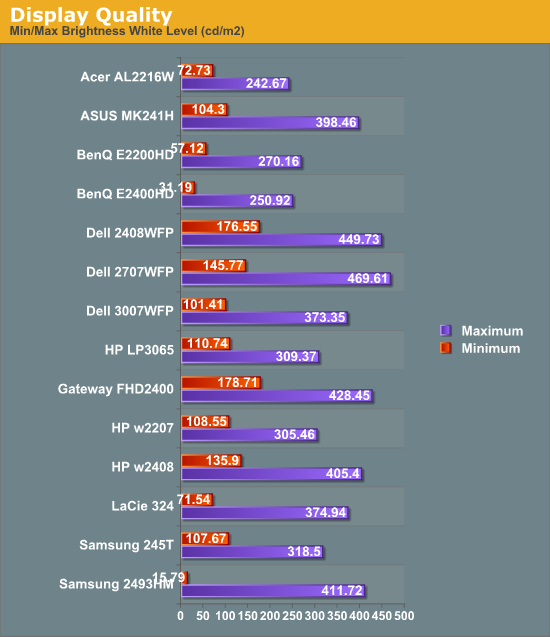
The two BenQ LCDs have a maximum brightness level of 250-270 nits, which is more than sufficient and is actually brighter than what most users prefer to use in an office environment. If you want to reach the advertised 300 nits brightness setting, you will need to adjust contrast and/or color levels as well. Minimum brightness at default settings is 30-50 nits, so there's typically no need to fiddle with color levels.
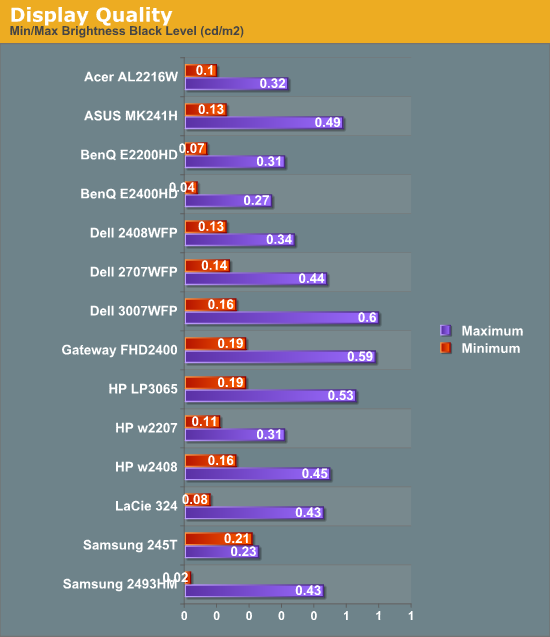
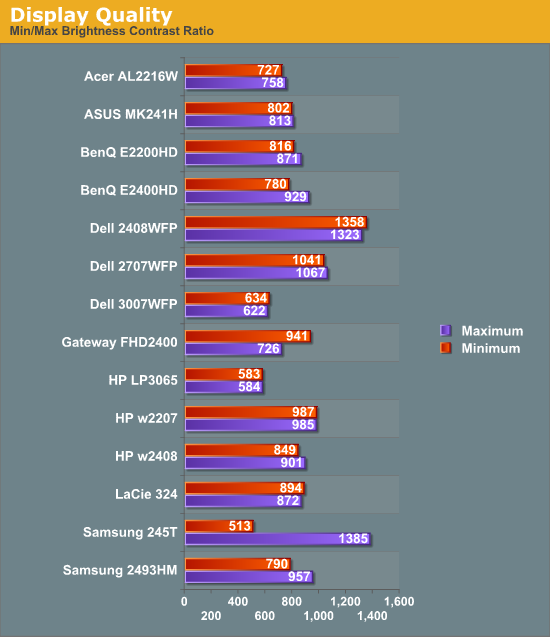
More important than the luminosity is the contrast ratio that is achievable at the various brightness settings. Depending on setting, we measured a contrast ratio of 780~930 with these LCDs. While higher scores are better, in reality anything above 700 is more than sufficient for most users. The Dell 2408WFP tops our charts, but this is mostly a victory of marketing numbers. Also, we wouldn't worry about any advertised dynamic contrast ratio numbers -- at least not if you want consistent colors.
Color Gamut
We've already shown color gamut for the LCDs, but here's a chart showing how the LCDs stack up against each other. We use Gamutvision, a utility developed by Imatest LLC to calculate color gamut. We compare the color profiles of the LCDs to the Adobe RGB 1998 color profile and report the results as a percentage.
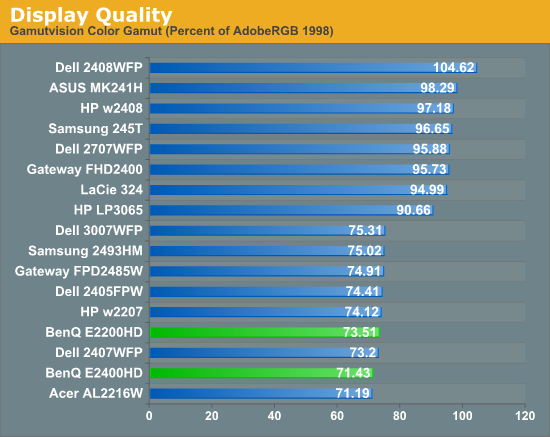
So far, color gamut has generally fallen into one of two categories: either +/-95% or +/-75%. The BenQ E2200HD and E2400HD target the budget market, so it's not too surprising that color gamut is lower than many competing models. However, it's important to keep things in perspective: these results may seem very low, but if you are using the standard sRGB profile (Windows' default) these LCDs look fine. It's only in applications like Adobe Photoshop with its improved color space that you begin to notice a difference between the displays.
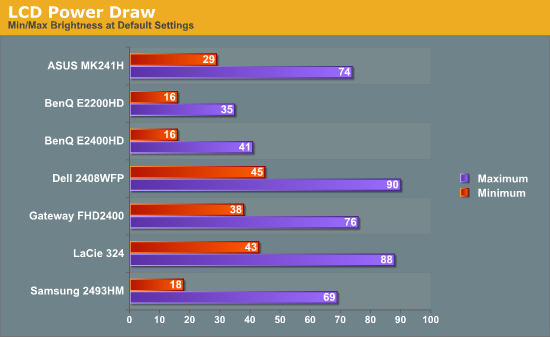
Power Requirements
We also look at power requirements, but we've changed our testing procedure somewhat since previous article. Minimum power requirements are going to depend largely on how dim the backlight is at the minimum setting, so a display that only puts out 16 nits at minimum brightness should logically use less power than one that puts out 50 nits. Since very few people will run an LCD at less than 100 nits, we tested at that level, as well as our standard 200 nits that we use for calibration, and finally at maximum brightness setting using default color and contrast settings. Since we changed testing procedures, we don't have equivalent information for any other LCDs yet, so we included a chart showing min/max power draw as well (our previous power test). We will report the new results in a table, along with brightness and contrast ratio information at the various settings.
| Power, Brightness, and Contrast Levels | ||
| BenQ E2200HD | BenQ E2200HD | |
| Maximum Power Draw | 36W | 41W |
| Maximum White | 270.16 | 250.92 |
| Maximum Black | 0.31 | 0.27 |
| Maximum Contrast | 871 | 929 |
| Calibrated Power Draw | 29W (66%) | 34W (73%) |
| Calibrated White | 199.3 | 199.23 |
| Calibrated Black | 0.23 | 0.22 |
| Calibrated Contrast | 867 | 906 |
| Print Power Draw | 20W (20%) | 24W (30%) |
| Print White | 100.03 | 99.34 |
| Print Black | 0.11 | 0.11 |
| Print Contrast | 909 | 903 |
Looking at just the two BenQ LCDs, it's no surprise that the larger E2400HD consumes slightly more power. Perhaps more interesting is that many old 20" CRTs could draw 100W or more and only attain a brightness level of ~120 nits. That's one more reason we prefer LCDs (along with a lot less strain on our backs when moving displays around). Even at maximum brightness, the BenQ displays both use less power than the other LCDs we've tested, but those displays may have been brighter so we can't make any definite conclusions about "greenness".


33 Comments
View All Comments
Meaker10 - Tuesday, November 4, 2008 - link
It's not having black bars or not, it's having black bars or no screen at all, I would rather have the black bars and the extra desktop space thanks.JarredWalton - Tuesday, November 4, 2008 - link
It's not a "rip-off" - it's a choice between two compromises. If you watch a 16:9 AR movie on a 16:10 LCD, the total size of the movie will be smaller than on a 16:9 AR LCD. FWIW, I'd go for the WUXGA 24" panels in most cases as well, but there are reasons to get native 16:9 instead. Since WUXGA is not an option on any current 22" panels, you get a higher desktop resolution and 1080P support - so you win both ways. That's one reason I gave it a Bronze award.Just for those who might be curious:
24" WUXGA = 259 in^2 screen area
24" 1080P = 246 in^2 screen area
1080P content on 24" WUXGA = 233 in^2 area
MadMan007 - Wednesday, November 5, 2008 - link
Lenovo makes a 22" WUXGA monitor.The reason people feel it's a ripoff is because it adds nothing to the value of a screen and is just a move for panel makers to reduce costs. Reduced cost is also part of the reason behind 16:10 widescreens but at least there's a benefit or reasonable tradeoff from 4:3 in terms of filling field of vision.
If 1920x1080 video content is the primary use for a display a TV would be a better purchase anyway.