CPU Performance Scaling
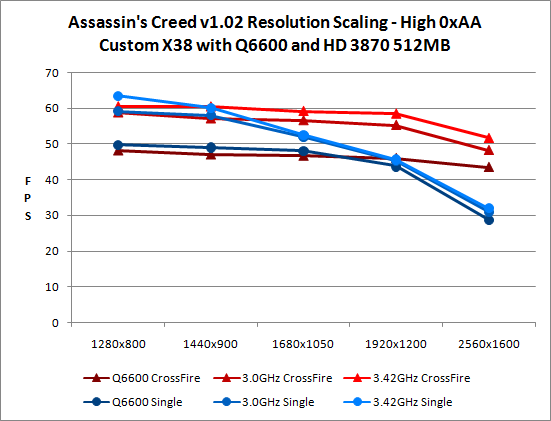
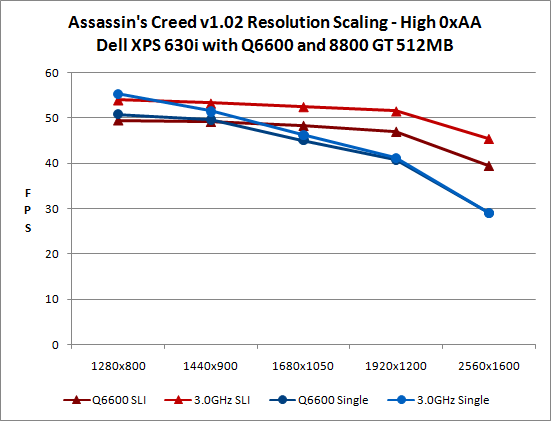
It would actually be quite interesting to take a closer look at how processors affect performance in AC. Specifically, I would have liked to test AMD Phenom as well as Core 2 Duo; this article is already long for a "game review", however, so I decided to stick with overclocking to see how it affects performance. The ATI and NVIDIA results are in separate graphs to help keep things legible. Since we couldn't enable anti-aliasing above 1680x1050, all testing was done at maximum detail with anti-aliasing disabled. We are also only reporting results for AC version 1.02, since the only area where 1.0 is faster is in anti-aliasing on ATI hardware.
If you're looking to get performance above 60 FPS, it's obvious that the first step is going to be purchasing the fastest CPU you can find. AC definitely supports dual-core processors, and even quad-core may be beneficial in certain situations. However, quad-core CPU usage often stays below 50% of the total CPU potential. Thus, an overclocked dual-core processor appears to be the best choice for maximizing AC performance.
During initial testing, we were a bit surprised to find that SLI didn't seem to improve performance. As this is a "The Way It's Meant to Be Played" game, that would have been another serious blow to NVIDIA's credibility. At the time, we were testing with a stock-clocked Q6600 at 1680x1050 and various graphics settings in order to utilize anti-aliasing. It was only when we began overclocking that we discovered the real culprit was CPU performance. There's CPU overhead associated with CrossFire and SLI, so with slower CPUs at moderate resolutions SLI and CrossFire will actually reduce performance in AC.
With an appropriately fast CPU -- at least 3.0 GHz would be our recommendation -- and running at 2560x1600, SLI and CrossFire are able to show substantial performance benefits. SLI and CrossFire both improve performance by 56%, but we still appear to be at least somewhat CPU limited. Increasing the CPU clock speed to 3.42 GHz on the X38 system (the maximum stable result for this particular system) further improves CrossFire scaling to 62%.
We should also take a moment to point out that in testing CrossFire did not work with both graphics chips until the latest catalyst 8.5 drivers. (That necessitated retesting all of our results, unfortunately, which is one more reason you're only reading this review now.) We heard a rumor that renaming the executable to COJ_DX10.exe (i.e. using the Call of Juarez CrossFire profile) would enable multi-GPU support; what we actually discovered was that renaming the executable did improve performance, but it improved it with single graphics cards as well. Whatever optimizations were taking place did not depend on CrossFire, and those optimizations now exist in an AC specific profile.
Finally, we need to caution against using the above results to compare ATI and NVIDIA graphics performance. The Dell system is running with DDR2-667 memory at 5-5-5-15 timings while the X38 system has DDR2-800 at 4-4-4-12 timings. The combination of BIOS tuning and memory performance could account for much of the performance differential. ATI looks to have a slight edge, but it's definitely not enough to make them a clear winner -- unless you're running 1680x1050 or lower with 4xAA.


32 Comments
View All Comments
bill3 - Monday, June 2, 2008 - link
Actually it's terrible, I cant read the graphs AT ALL.seriously my eyes just glazed over those terrible charts..completely unreadable. I still, have no idea what I'm looking at. Is ATI supposed to be faster in this game? Why did they test with version 1.00 on ATI and 1.2 on Nvidia? I dont know because the graphs are totally useless.
Nihility - Monday, June 2, 2008 - link
I second that. The graphs are terrible. Maybe bar graphs would have been better?Sometimes when you're the one making the graph it's hard to imagine what other people are seeing when they look at them. I suggest having another pair of eyes check the graphs out for readability.
Besides that, I loved the review. Especially the performance part and the 10.1 controversy.
JarredWalton - Tuesday, June 3, 2008 - link
Charts are colored with similar colors used either for ATI vs. NVIDIA, 1.00 vs. 1.02, or dual-GPU vs. single-GPU. I could have generated four times as many graphs to show the same data, but I figure most people are capable of reading the labels on a chart and figuring out what they mean. Here's a hint: when you can't see the difference between two lines because they overlap, it's a tie.If you want to give specific examples and recommendations on what would look better and still convey the same amount of information, I'm all ears. However, simply stating that "the graphs are terrible" does little to help. Tell me what graph specifically is terrible, and tell me why it's terrible.
As an example of why I used these graphs, page 9 has two charts showing 40 total data points. You can get a clear idea of how performance scales with single or dual GPUs at the various detail settings looking at a single chart. Green is NVIDIA, Red is ATI. That makes a lot of sense to me. Creating ten different bar charts with four lines in each to show the same data makes it more difficult to compare how Medium graphics compares to High graphics performance, and it takes up five times as much space to tell the same "story".
Page 6 is the same thing, but with green used for dual-GPUs (light and dark for 1.00 and 1.02) and red for single GPUs. 24 data points in two charts instead of using six charts. Having established that 1.00 doesn't perform any different than 1.02 on NVIDIA hardware, I skipped the 1.00 NVIDIA numbers to make those charts easier to read on page 7. Then I put in the four standard test system (0xAA and 4xAA, ATI and NVIDIA) on 1.02, with 1.00 4xAA ATI in blue as a reference.
Lastly, on page 8 I have two clock speeds on NVIDIA, three on ATI, with different base colors for single and dual GPUs. ATI and NVIDIA are in separate charts, and brighter colors are for a higher overclock.
There's method to my graphing madness. Are the charts immediately clear to a casual glance? No, but then that's really difficult to do while still conveying all of the information. I spent a lot of time trying to make comprehensible charts, and settled on these as the best option I could come up with. Again, if they're so bad, it must be easy to generate something clearly better - have at it, and I'll be happy to use any sensible suggestions. However, if the only complaint is that you actually have to look at the charts and think for a minute before you understand, I'm not likely to be very sympathetic. I think our readers are smart enough to digest these graphs.
mpjesse - Monday, June 2, 2008 - link
While I appreciate the detailed review, isn't it a little irrelevant now? I mean, the game's been out for nearly 2 months now and it's been reviewed everywhere. The only thing new about this review are the performance benchmarks, in which case I would have have made the review solely about performance instead of gameplay.Just my 2 cents.
ImmortalZ - Monday, June 2, 2008 - link
Its sad that the companies with money always manage to suppress innovation.I hope this article by AT will raise some ruckus in the collective Interwebs and cause something. But I doubt it.
ViRGE - Monday, June 2, 2008 - link
For what it's worth, another forum I read had some screenshots comparing DX10 and DX10.1. The problems the poster had managed to find involved trees; there was some kind of post-processing rendering going on with trees that wasn't occurring with DX10.1, which made them look weird.Not fixing 10.1 may be an NVIDIA thing, but there was definitely a problem with it as-is.
tuteja1986 - Monday, June 2, 2008 - link
Well why where the hell is nvidia dx10.1 support if dx10.1 actually brings some kind of performance improvement in AA.Why aren't GT200 series have DX10.1 ?
I thought PC gaming was all about being the cutting edge on all technology front...
Anyways , this is not the 1st time Ubisoft or Nvidia have done this.
wyemarn - Monday, June 2, 2008 - link
Maybe because Nvidia GPUs cant support AA through shaders. So no use supporting dx 10.1. ATI GPUs have 320 stream processors so it can utilize for shaders and etc. Nvidia cards have less SPs but more ROPs, TMUs which translates to more brute power if games dont use shaders or SPs much. Technology wise, I think ATI is ahead but NVIDIA GPUs have game developer support and more raw horsepower so performance wise NVIDIA is ahead and I think this trend will continue with GTX200 series. I choosed G92 over RV670 because the raw performance is much better even though on paper HD 3800 series look great.SteelSix - Monday, June 2, 2008 - link
Worthy of a thread in Video. I just started one..Gannon - Monday, June 2, 2008 - link
The original halo had performance issues but they weren't alarming, halo was actually not too bad port compared to many other console to PC disasters. Halo 1 got 'better with hardware' advancing. Halo 2 on the other hand is just all around atrocious. Halo 2 was just not a very well made game, period, despite the addition of cutscenes, etc. Halo 1 had a much better feel and better vehicle design IMHO, I hated how the warthog looked in Halo 2, it annoyed me to no end.