Midrange CPU Roundup: It's Time to Buy
by Anand Lal Shimpi on September 28, 2007 2:00 AM EST- Posted in
- CPUs
Changing the Game: Overclocking
Although AMD is unusually competitive in the mainstream segment, it's a whole new ballgame once you take overclocking into account. The type of overclocking we're talking about here is very mild, using nothing more than stock coolers and not pushing voltages too high. The goal is getting more bang for your buck without sacrificing stability or increasing the price; we're trying to see how much you can really get from these ultra-affordable CPUs. Our table of overclocks is listed below:
You can see that the AMD chips overclock a bit but nowhere near as well as the Intel CPUs. Intel has a slightly deeper pipeline which allows it to reach higher clock speeds somewhat easier; the rest of the headroom may simply be due to advantages in Intel's 65nm process over AMD's. Remember that Intel has been manufacturing 65nm CPUs for much longer than AMD, thus having had more time to fine tune the process to maximize clock speed and minimize thermals.
We ran a single benchmark to showcase the improvement you'd get from these simple overclocks (at least in CPU limited situations). The benchmark we chose was our WME9 test, which is fairly close between AMD and Intel to begin with, giving both a fair starting point prior to overclocking:
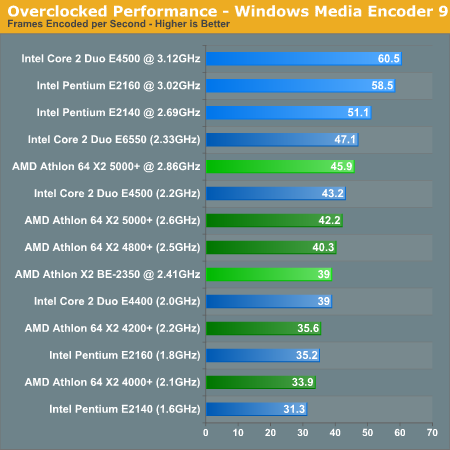
Here's the problem: the fastest AMD CPU we tested gets around 45 fps in our WME test, while the cheapest Intel CPU when overclocked gets 51 fps. There's no simpler way of putting it: if you take overclocking into account, there's just no way to even consider the AMD CPUs. With the Pentium E2140 and 2160 boasting 65%+ overclocks, their performance reaches levels greater than the Athlon 64 X2 5000+ (and some of the faster Athlon X2 CPUs as well).
Although AMD is unusually competitive in the mainstream segment, it's a whole new ballgame once you take overclocking into account. The type of overclocking we're talking about here is very mild, using nothing more than stock coolers and not pushing voltages too high. The goal is getting more bang for your buck without sacrificing stability or increasing the price; we're trying to see how much you can really get from these ultra-affordable CPUs. Our table of overclocks is listed below:
| Overclocking Results (Stock HSF) | |||
| CPU | Stock Clock | Overclock | Percentage |
| AMD Athlon 64 X2 5000+ | 2.6GHz | 2.86GHz | 10% |
| AMD Athlon X2 BE-2350 | 2.1GHz | 2.41GHz | 14.70% |
| Intel Core 2 Duo E4500 | 2.2GHz | 3.12GHz | 41.80% |
| Intel Pentium E2160 | 1.8GHz | 3.02GHz | 67.70% |
| Intel Pentium E2140 | 1.6GHz | 2.69GHz | 68.10% |
You can see that the AMD chips overclock a bit but nowhere near as well as the Intel CPUs. Intel has a slightly deeper pipeline which allows it to reach higher clock speeds somewhat easier; the rest of the headroom may simply be due to advantages in Intel's 65nm process over AMD's. Remember that Intel has been manufacturing 65nm CPUs for much longer than AMD, thus having had more time to fine tune the process to maximize clock speed and minimize thermals.
We ran a single benchmark to showcase the improvement you'd get from these simple overclocks (at least in CPU limited situations). The benchmark we chose was our WME9 test, which is fairly close between AMD and Intel to begin with, giving both a fair starting point prior to overclocking:
Here's the problem: the fastest AMD CPU we tested gets around 45 fps in our WME test, while the cheapest Intel CPU when overclocked gets 51 fps. There's no simpler way of putting it: if you take overclocking into account, there's just no way to even consider the AMD CPUs. With the Pentium E2140 and 2160 boasting 65%+ overclocks, their performance reaches levels greater than the Athlon 64 X2 5000+ (and some of the faster Athlon X2 CPUs as well).


44 Comments
View All Comments
Darth Farter - Friday, September 28, 2007 - link
why not the cool & quiet idle power numbers?seeing they're running at full speeds at idle is besides the point of an "idle" measurement in this age with powersavings...
tnx though on the bios update request from asus... I want to tweak my timings too.
Anand Lal Shimpi - Friday, September 28, 2007 - link
C&Q and EIST were both enabled for the idle and load power numbers. Actually all the benchmarks were run with those settings enabled.Take care,
Anand
archcommus - Friday, September 28, 2007 - link
I realize the benchmarks are run at 1024x768 to make the tests CPU-limited, does that mean all, or at least most, of the extra horsepower needed for resolutions above that comes from the GPU? If so, does that mean I could run games at 1280x1024 well with a high-end card and one of the AMD CPUs from this round-up? Or would that be a bad match-up? If that would work it's an appealing upgrade path alternative to jumping platforms.nosfe - Friday, September 28, 2007 - link
why not color code those performance graphs so that we can easily see which processors are competing at the same price