Midrange CPU Roundup: It's Time to Buy
by Anand Lal Shimpi on September 28, 2007 2:00 AM EST- Posted in
- CPUs
3D Rendering Performance
Using 3dsmax 9 SP1 we ran the CPU rendering composite tests of the SPECapc 3dsmax benchmark:
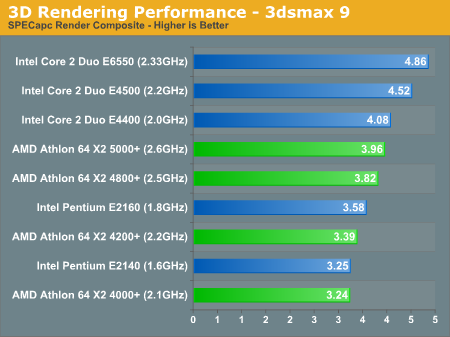
Intel manages to hold onto a reasonable lead with the E4500 outperforming the 5000+ by 14%. The E4400 and 4800+ are closer thanks to a much lower clock speed for the E4400, while the Pentium E2160 squeezes by with a 10% advantage over the 4000+. The overall win here is Intel, except if you are comparing the E4400 to AMD's 4800+.
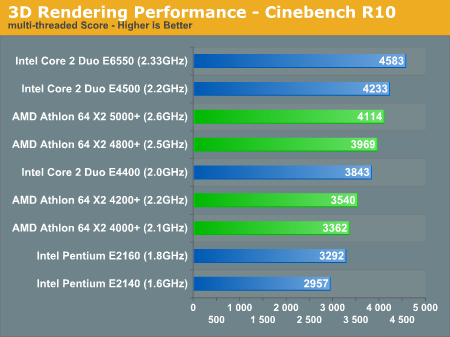
The new Cinebench R10 benchmark gives us an incredibly even breakdown between AMD and Intel; at the same price points we have a virtual performance parity:
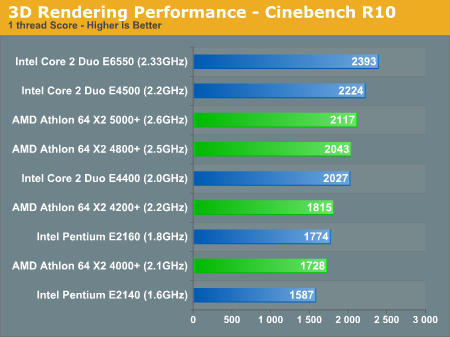
Cinebench also offers a single-threaded version of the benchmark, allowing us to get an idea of how big of a performance boost AMD and Intel see when going from one to two cores:
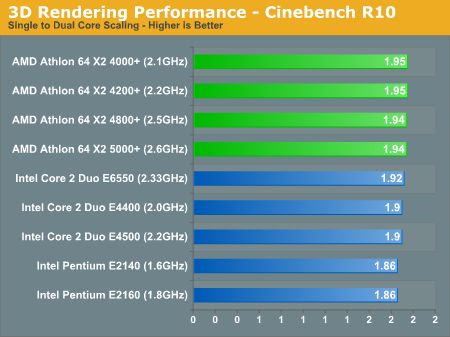
Note that all the AMD CPUs manage to improve performance around 1.94 - 1.95x when running the multi-threaded benchmark over the single-threaded version, while the Intel chips mostly fall at or below 1.9x. Intel scales better with larger cache sizes and faster FSB frequencies, which is why we see the E4000 chips do better than the E2000 chips and the E6550 doing better than both. All of this becomes a non-issue with Nehalem, when Intel moves away from the FSB and embraces a point-to-point bus interface and on-die memory controller similar to AMD's Direct Connect architecture.
Our final 3D rendering test is the latest POV-Ray beta with its built in multi-threaded benchmark:
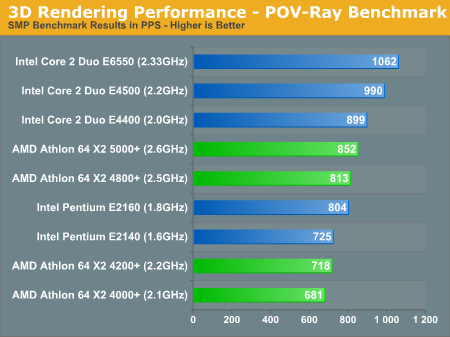
Intel takes the clear lead here, with the E4400 outperforming the 5000+ and the E2160 virtually tying the 4800+.
Using 3dsmax 9 SP1 we ran the CPU rendering composite tests of the SPECapc 3dsmax benchmark:
Intel manages to hold onto a reasonable lead with the E4500 outperforming the 5000+ by 14%. The E4400 and 4800+ are closer thanks to a much lower clock speed for the E4400, while the Pentium E2160 squeezes by with a 10% advantage over the 4000+. The overall win here is Intel, except if you are comparing the E4400 to AMD's 4800+.
The new Cinebench R10 benchmark gives us an incredibly even breakdown between AMD and Intel; at the same price points we have a virtual performance parity:
Cinebench also offers a single-threaded version of the benchmark, allowing us to get an idea of how big of a performance boost AMD and Intel see when going from one to two cores:
Note that all the AMD CPUs manage to improve performance around 1.94 - 1.95x when running the multi-threaded benchmark over the single-threaded version, while the Intel chips mostly fall at or below 1.9x. Intel scales better with larger cache sizes and faster FSB frequencies, which is why we see the E4000 chips do better than the E2000 chips and the E6550 doing better than both. All of this becomes a non-issue with Nehalem, when Intel moves away from the FSB and embraces a point-to-point bus interface and on-die memory controller similar to AMD's Direct Connect architecture.
Our final 3D rendering test is the latest POV-Ray beta with its built in multi-threaded benchmark:
Intel takes the clear lead here, with the E4400 outperforming the 5000+ and the E2160 virtually tying the 4800+.


44 Comments
View All Comments
Darth Farter - Friday, September 28, 2007 - link
why not the cool & quiet idle power numbers?seeing they're running at full speeds at idle is besides the point of an "idle" measurement in this age with powersavings...
tnx though on the bios update request from asus... I want to tweak my timings too.
Anand Lal Shimpi - Friday, September 28, 2007 - link
C&Q and EIST were both enabled for the idle and load power numbers. Actually all the benchmarks were run with those settings enabled.Take care,
Anand
archcommus - Friday, September 28, 2007 - link
I realize the benchmarks are run at 1024x768 to make the tests CPU-limited, does that mean all, or at least most, of the extra horsepower needed for resolutions above that comes from the GPU? If so, does that mean I could run games at 1280x1024 well with a high-end card and one of the AMD CPUs from this round-up? Or would that be a bad match-up? If that would work it's an appealing upgrade path alternative to jumping platforms.nosfe - Friday, September 28, 2007 - link
why not color code those performance graphs so that we can easily see which processors are competing at the same price