Intel Core 2 Q6600 G0 Stepping: Cheap Quad Core Just Got Better
by Anand Lal Shimpi on August 16, 2007 11:53 AM EST- Posted in
- CPUs
Performance
We know the new stepping uses less power than its predecessor, and overclocks a little better, but do any of the errata fixes result in a performance increase? To find out we ran two benchmarks: our Windows Media Encoder 9 test and our Cinebench 9.5 benchmark. We ran the tests at both stock and overclocked speeds, the results are below:
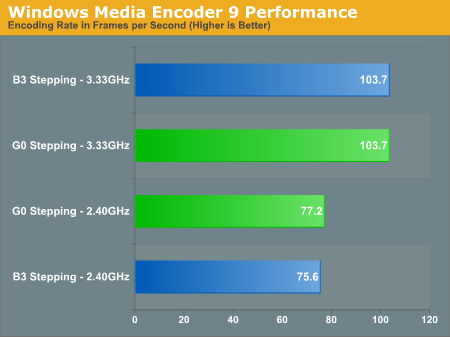
There are very slight differences in performance but nothing that falls out of the range of normal variation between tests.
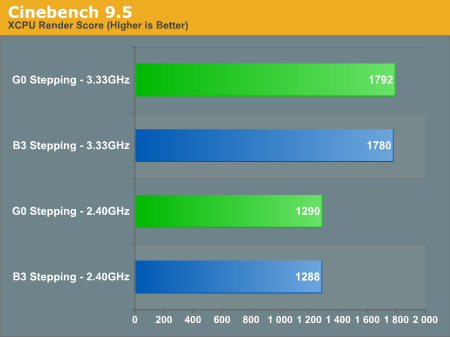
This sort of insignificant performance difference between steppings is to be expected, no surprises here.
Final Words
Power consumption of the new G0 cores is not only better than their predecessors, but it seems to scale better with clock speed. As we overclocked our Q6600s total system power consumption increased at a slightly lower rate with the new G0 stepping than with the previous B3 cores. The power savings aren't tremendous, we're talking on the order of 3 - 6% depending on clock speed, but it is a measurable improvement.
The impact on overclocking is a little less clear, at least with the quad-core Q6600. We were able to reach a higher maximum overclock with the SLACR stepping Q6600, but our highest stable overclock was not that much more than our original B3 stepping. If we look at percentages, our G0 part managed a 3 - 6% better overclock, putting overclocking potential in line with the power savings we noted. It's not a tremendously better overclocker but we suspect that on a whole it will yield tangible benefits.
There's no doubt that the new G0 stepping cores represent the latest improvements in the Core 2 lineup, but it's worthwhile to keep expectations in line with reality. If you're looking for a huge change in power consumption/overclocking headroom, you may have to wait for Intel's 45nm Penryn cores.


34 Comments
View All Comments
Anand Lal Shimpi - Thursday, August 16, 2007 - link
Both chips used the same VID surprisingly enough, that's part of what made this test so easy. I have seen differing results at 8x vs. 9x multipliers, but it didn't seem to make a huge difference when I tried it with these chips. I'll keep playing around with them though.Take care,
Anand
Kougar - Thursday, August 16, 2007 - link
Hi Anand!Could you please mention what the VID was, if it was identical between chips then it sounds like it was over 1.3v?
You probably had already seen http://forums.anandtech.com/messageview.aspx?catid...">http://forums.anandtech.com/messageview.aspx?catid... but I thought it was interesting that some of the VIDs are so low. My own sample is also 1.200v and seems to OC well enough, a partially corrupted OS notwithstanding anyway.
My Pentium M barely operates stable at 2.13GHz using 1.18v and it's obviously single core, so it just sounds odd that a 2.4Ghz Quadcore could have an even lower VID than 1.18v even with the 90nm -> 65nm difference. Maybe that is just me though!
Anand Lal Shimpi - Thursday, August 16, 2007 - link
It was 1.20V on both chips I believe.Take care,
Anand
Grit - Thursday, August 16, 2007 - link
Woot!