Render Servers
To get a better idea on how the different server platforms compare, we did some rendering too. Most of our tests (MySQL, DB2, and SPECjbb2005) are very integer intensive; render tests are floating point intensive. We start with a simple Cinebench 9.5 benchmark (on Windows 2003 32-bit), which is based on Maxon's Cinema 4D rendering engine.
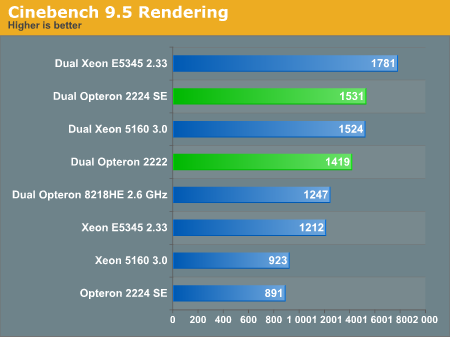
Cinebench runs almost perfectly within the caches of all CPUs. The Opteron 2224 does pretty well thanks to its strong x87 FPU. As we have noted before, the Opteron scales slightly better than its Intel Competitor. This gets even clearer when you look at the performance of one core. One Opteron 3.2GHz core scores 472 and gets 3.24 times faster when you quadruple the number of cores. One Intel core at 3GHz scores 499 and gets 3.05 times faster with 4 cores. We admit we are nitpicking, but it is interesting nevertheless.
3DS Max 9
Cinebench is popular because it is an easy benchmark, 3DS Max is a very popular application. We tested with 3DS Max version 9, which has been improved to work better with multi-core systems. We used the "architecture" scene, which has been a favorite benchmarking scene for years. All tests were done with 3ds max's default scanline renderer, SSE enabled, and we rendered at HD 720p (1280x720) resolution. We measured the time it takes to render 10 frames from 20 to 29. All results are reported in seconds, lower being better.

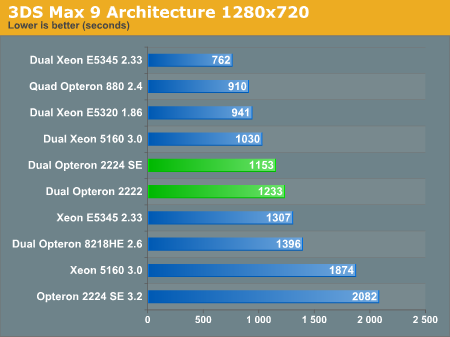
As this test has been our standard test for a while, we added a few results from previous tests. As you increase the resolution, multi-core scaling gets better. The reason is that there's a certain amount of overhead required to split a scene into multiple parts. At lower resolutions, the splitting process ends up taking a significant amount of time, so the extra cores are not fully able to stretch their legs.
To get a better idea on how the different server platforms compare, we did some rendering too. Most of our tests (MySQL, DB2, and SPECjbb2005) are very integer intensive; render tests are floating point intensive. We start with a simple Cinebench 9.5 benchmark (on Windows 2003 32-bit), which is based on Maxon's Cinema 4D rendering engine.
Cinebench runs almost perfectly within the caches of all CPUs. The Opteron 2224 does pretty well thanks to its strong x87 FPU. As we have noted before, the Opteron scales slightly better than its Intel Competitor. This gets even clearer when you look at the performance of one core. One Opteron 3.2GHz core scores 472 and gets 3.24 times faster when you quadruple the number of cores. One Intel core at 3GHz scores 499 and gets 3.05 times faster with 4 cores. We admit we are nitpicking, but it is interesting nevertheless.
3DS Max 9
Cinebench is popular because it is an easy benchmark, 3DS Max is a very popular application. We tested with 3DS Max version 9, which has been improved to work better with multi-core systems. We used the "architecture" scene, which has been a favorite benchmarking scene for years. All tests were done with 3ds max's default scanline renderer, SSE enabled, and we rendered at HD 720p (1280x720) resolution. We measured the time it takes to render 10 frames from 20 to 29. All results are reported in seconds, lower being better.
As this test has been our standard test for a while, we added a few results from previous tests. As you increase the resolution, multi-core scaling gets better. The reason is that there's a certain amount of overhead required to split a scene into multiple parts. At lower resolutions, the splitting process ends up taking a significant amount of time, so the extra cores are not fully able to stretch their legs.


30 Comments
View All Comments
piroroadkill - Tuesday, August 7, 2007 - link
it is a car analogyGul Westfale - Monday, August 6, 2007 - link
good analogy there, except that mustangs (and various other cars) use pickup truck engines for cost reasons. large trucks use larger engines (often diesels) because they offer considerably more torque at much lower RPM than a smaller gasoline engine; and thus provide more pulling power.Gul Westfale - Monday, August 6, 2007 - link
these are not regular consumer cpus, but intended for use in commercial servers and workstations. they and their motherboards cost more because they support features such as multiple sockets (so in addition to having multiple cores on one chip you can also have multiple chips on one motherboard).yyrkoon - Monday, August 6, 2007 - link
they win 1 of 2 tests, and it is clear they are the winner ? Why ? Because they won the software rendering also ? Anyone interrested enough in rendering, and HAVING to have this sort of hardware for it is NOT going to bother with software . . .
This means your conclusion on this point is incorrect, and in which case, it boils down to which application the rendering machine is going to do.
Man you guys come to the wierdest conclusions based on your own data, and I am not even the first to notice/mention this sort of thing . . .
JohanAnandtech - Monday, August 6, 2007 - link
The Quadcore wins all high resolution rendering tests. Where do you see the DC opterons win against the Quadcore Intel in high resolution rendering? Show me a rendering engine where a 3 GHz K8 DC core is faster in high resolution renderering than a 2.33 GHz Quadcore. All decent and used in the realworld rendering engines will more or less show the same picture.In fact, the "rendering performance" situation will get worse for the K8 as SSE-2 tuning will get more common. All Intel CPUs since core and all AMD CPUs since Barcelona will show (or are already showing) high performance boost from using better SSE-2 code.
yyrkoon - Monday, August 6, 2007 - link
Ok, I see now with the graphs 'lower is better' on 3ds max, I missed that with the tables, which is actually what I meant this morning 'table obfustication'. I personally do not mind tables, but when the data is not in a uniform spot, it confuses/makes it harder to read at a glance.Anyhow, I was tired when I posted this morning, cranky, and was overly harsh I think. However it *is* much easier for me personaly to read the graphs at a glance (I cannot speak for everyone though).
yyrkoon - Monday, August 6, 2007 - link
Oh, and while on the subject, you guys here at anandtech have lately mastered the art of graph obfustication. Is it really THAT hard leaving items in the same rows / columns for different tests ? Are we trying to confuse the results, or is there some other reason this happens, and has gone completely over my head ?JohanAnandtech - Monday, August 6, 2007 - link
The only reason is that until very recently I didn't master the graphing engine. I got some weird error messages and gave up. But I have found the error, and you should see some nice graphs which don't obfusticate...Spoelie - Monday, August 6, 2007 - link
the gif on page 2 is non-looping, so after a very quick jump from 1ghz -> 2.8ghz (why??) -> 3.2ghz , it stays put on the 3.2ghz image. If reading the article, by the time the reader sees the image, it's already 5 minutes on the last image and staying there, making it for all intents and purposes a static image instead of an animated one:)
JohanAnandtech - Monday, August 6, 2007 - link
Thanks, fixed that. The reason to show 2.8 GHz is that for example Specjbb and other applications sometimes don't completely stress the CPU and then the cpu dynamically goes back to 2.8 GHz. It are simply the 3 stages I saw the most, and found the most interesting to show.