Biostar TF560 A2+: Overclocking NVIDIA's new nForce 560
by Gary Key on August 2, 2007 12:15 AM EST- Posted in
- Motherboards
Synthetic Graphics Performance
The 3DMark series of benchmarks developed and provided by Futuremark are among the most widely used tools for benchmark reporting and comparisons. Although the benchmarks are very useful for providing apples-to-apples comparisons across a broad array of GPU and CPU configurations they are not a substitute for actual application and gaming benchmarks. In this sense we consider the 3DMark benchmarks to be purely synthetic in nature but still very valuable for providing consistent measurements of performance.

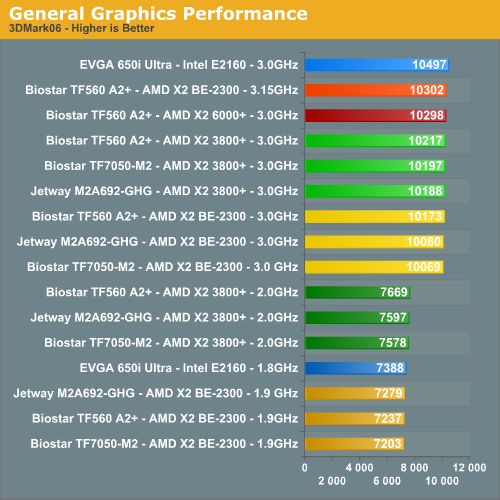
In our 3DMark06 test, our budget level processors are bunched together with a 6.5% spread between the three at stock settings. As expected the X2 3800+ edges out the E2160 and BE-2300 at stock settings in this CPU intensive benchmark but the Intel Core architecture comes alive in our first overclocking result. The spread is only 4.3% at the top with our latency deprived BE-2300 needing an additional overclock to 3.15GHz to overtake our X2 6000+ reference CPU. The BE-2300 has a performance increase of 38% when overclocked while the X2 3800+ improves by 33%. That's not bad for either CPU, considering that when combined with the Biostar TF560 A2+ board they still cost less than the X2 6000+ CPU.
In the more memory/CPU throughput sensitive 3DMark01 benchmark we see the same pattern at stock settings. The spread from top to bottom is 6.4% at stock but increases to 8.3% during overclocking. However, the differences in performance are not really noticeable in either 3DMark application unless you are looking for higher benchmark scores. The BE-2300 has an overclocking performance increase of 40% while the X2 3800+ only improves by 33%, mainly due to its lower HTT setting.
Looking at the three AM2 motherboards/chipsets, all of the CPU results tend to be clustered closely together with one exception. The BE-2300 in the nF7050 board outperforms the other two chipsets by 6% in 3DMark01. It appears that the BIOS on that board may be somewhat better tuned for the Brisbane core, though when we asked for more details we couldn't get a straight answer from any of the involved parties.
General System Performance
The PCMark05 benchmark developed and provided by Futuremark was designed for determining overall system performance for the typical home computing user. This tool provides both system and component level benchmarking results utilizing subsets of real world applications or programs. This benchmark is useful for providing comparative results across a broad array of Graphics, CPU, Hard Disk, and Memory configurations along with multithreading results. In this sense we consider the PCMark benchmark to be both synthetic and real world in nature, and it again provides for consistency in our benchmark results.
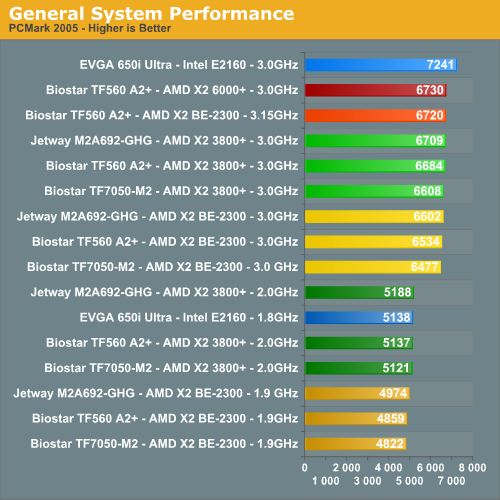
The performance spread in the stock score is 7.6% and 11.8% when overclocked, although in individual areas the differences between the CPUs may be more or less pronounced. In fact, it was in the first and third multitasking tests where our BE-2300 trailed our other solutions in both stock and overclocked settings. This is due in part to increased latencies in the L2 cache and the reduction in memory speed when compared to our other two budget CPUs. The BE-2300 has a performance increase of 34% while the X2 3800+ improves by 30% when overclocked; meanwhile, the E2160 improves by 41% with overclocking.
All three AM2 boards are clustered within about 1.5% of each other (about the margin of error in PCMark05), although the spread is slightly higher at 3% with the stock Brisbane core. This time, the 690G Jetway board ends up being the fastest of the three AM2 options, while the nF7050 finishes in third place - not that anyone would really notice a 1% difference in practice outside of running benchmarks.
The 3DMark series of benchmarks developed and provided by Futuremark are among the most widely used tools for benchmark reporting and comparisons. Although the benchmarks are very useful for providing apples-to-apples comparisons across a broad array of GPU and CPU configurations they are not a substitute for actual application and gaming benchmarks. In this sense we consider the 3DMark benchmarks to be purely synthetic in nature but still very valuable for providing consistent measurements of performance.
In our 3DMark06 test, our budget level processors are bunched together with a 6.5% spread between the three at stock settings. As expected the X2 3800+ edges out the E2160 and BE-2300 at stock settings in this CPU intensive benchmark but the Intel Core architecture comes alive in our first overclocking result. The spread is only 4.3% at the top with our latency deprived BE-2300 needing an additional overclock to 3.15GHz to overtake our X2 6000+ reference CPU. The BE-2300 has a performance increase of 38% when overclocked while the X2 3800+ improves by 33%. That's not bad for either CPU, considering that when combined with the Biostar TF560 A2+ board they still cost less than the X2 6000+ CPU.
In the more memory/CPU throughput sensitive 3DMark01 benchmark we see the same pattern at stock settings. The spread from top to bottom is 6.4% at stock but increases to 8.3% during overclocking. However, the differences in performance are not really noticeable in either 3DMark application unless you are looking for higher benchmark scores. The BE-2300 has an overclocking performance increase of 40% while the X2 3800+ only improves by 33%, mainly due to its lower HTT setting.
Looking at the three AM2 motherboards/chipsets, all of the CPU results tend to be clustered closely together with one exception. The BE-2300 in the nF7050 board outperforms the other two chipsets by 6% in 3DMark01. It appears that the BIOS on that board may be somewhat better tuned for the Brisbane core, though when we asked for more details we couldn't get a straight answer from any of the involved parties.
General System Performance
The PCMark05 benchmark developed and provided by Futuremark was designed for determining overall system performance for the typical home computing user. This tool provides both system and component level benchmarking results utilizing subsets of real world applications or programs. This benchmark is useful for providing comparative results across a broad array of Graphics, CPU, Hard Disk, and Memory configurations along with multithreading results. In this sense we consider the PCMark benchmark to be both synthetic and real world in nature, and it again provides for consistency in our benchmark results.
The performance spread in the stock score is 7.6% and 11.8% when overclocked, although in individual areas the differences between the CPUs may be more or less pronounced. In fact, it was in the first and third multitasking tests where our BE-2300 trailed our other solutions in both stock and overclocked settings. This is due in part to increased latencies in the L2 cache and the reduction in memory speed when compared to our other two budget CPUs. The BE-2300 has a performance increase of 34% while the X2 3800+ improves by 30% when overclocked; meanwhile, the E2160 improves by 41% with overclocking.
All three AM2 boards are clustered within about 1.5% of each other (about the margin of error in PCMark05), although the spread is slightly higher at 3% with the stock Brisbane core. This time, the 690G Jetway board ends up being the fastest of the three AM2 options, while the nF7050 finishes in third place - not that anyone would really notice a 1% difference in practice outside of running benchmarks.


21 Comments
View All Comments
DrMrLordX - Thursday, August 2, 2007 - link
AM2+ K10 chips will "plop right in"to AM2 boards with the proper BIOS support, so I would assume they would work in this board too, regardless of whether it supports HT3, separates power planes, etc. Of course, that's all up to the board manufacturer and their BIOS support for K10.