Gigabyte's New Odin GT 800W Power Supply
by Christoph Katzer on July 24, 2007 12:01 AM EST- Posted in
- Cases/Cooling/PSUs
The P-Tuner Software
We have mentioned the software quite a few times already, so let's take a closer look. The P-Tuner software can be found on the CD. The installation is very easy but it does have one big flaw: it automatically detects the language of the operating system installed on the PC and uses that. You cannot change the language which unfortunately leaves us with the German version of the software since that is the language on our test PC. (Ed: Guten tag?) We might also point out that the translation used for some items is incorrect, and likely that is the same for other languages as well. Hopefully the language issue will be corrected with a patch in the near future, but for now you'll have to deal with German screenshots.
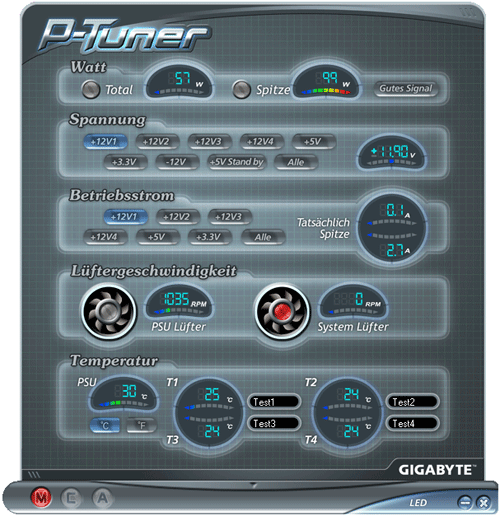
After a successful installation you will be greeted with this screen. This will only occur if the connection between the power supply and system is functioning correctly; if the connection is not established the software fails to start.
On the main-screen we have the actual usage of the system in watts on the left side and the highest amount used during that session on the right side. Compared to our results using the Chroma equipment, the amounts shown aren't identical. For example, with lower load testing we measured 160W from the rails and the software only showed 130W. If that amount had been correct we would have only had 68% efficiency, since the system was drawing 190W from the AC source. At higher loads the software showed 875W and in reality we were only drawing 771W - it's unfortunate that the software was incorrect, as we were about ready to start selling perpetual motion machines. In short, the results of the software are nothing close to reality, but it looks nice and it does at least give home users a place to start.
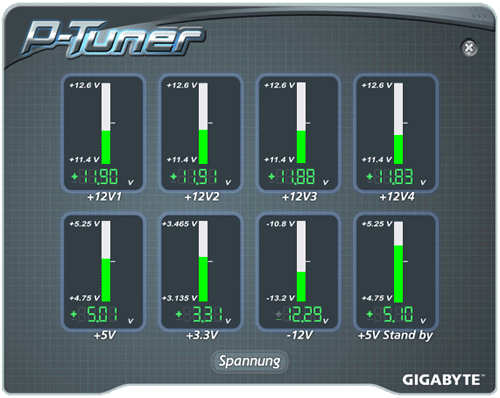
The second row shows the voltages of each rail. Each rail can be shown by clicking on it. If you want to see all rails at the same time you just click the All ("Alle") button on the lower right side of this row. A second screen will open and show all rails and their respective voltages. We compared the voltage on each rail with our equipment and found the results were quite similar. The differences were in the millivolt range and not more (i.e. less than .01V).
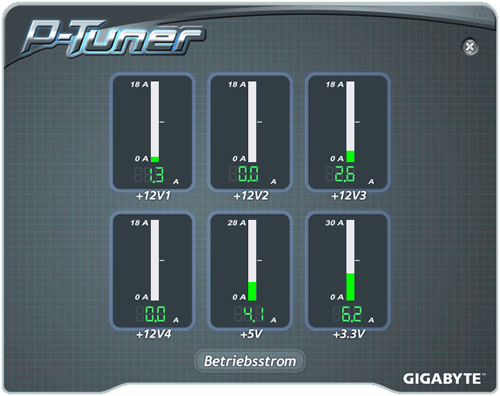
The third row shows the actual power drawn on each rail. By clicking on each rail the load can be seen in the little round display on the right side. The upper amount shows the actual used power on the chosen rail and the lower amount shows the highest power drawn on that rail during the current session. The amounts shown were not been equal to the actual loads we had put on the rails. We measured differences of up to 10A. Bringing up the details display, we can see all rails at once. The display shows on all 12V rails with a maximum 18A which is not quite accurate since two of the rails are rated at 25A.
We have mentioned the software quite a few times already, so let's take a closer look. The P-Tuner software can be found on the CD. The installation is very easy but it does have one big flaw: it automatically detects the language of the operating system installed on the PC and uses that. You cannot change the language which unfortunately leaves us with the German version of the software since that is the language on our test PC. (Ed: Guten tag?) We might also point out that the translation used for some items is incorrect, and likely that is the same for other languages as well. Hopefully the language issue will be corrected with a patch in the near future, but for now you'll have to deal with German screenshots.
After a successful installation you will be greeted with this screen. This will only occur if the connection between the power supply and system is functioning correctly; if the connection is not established the software fails to start.
On the main-screen we have the actual usage of the system in watts on the left side and the highest amount used during that session on the right side. Compared to our results using the Chroma equipment, the amounts shown aren't identical. For example, with lower load testing we measured 160W from the rails and the software only showed 130W. If that amount had been correct we would have only had 68% efficiency, since the system was drawing 190W from the AC source. At higher loads the software showed 875W and in reality we were only drawing 771W - it's unfortunate that the software was incorrect, as we were about ready to start selling perpetual motion machines. In short, the results of the software are nothing close to reality, but it looks nice and it does at least give home users a place to start.
The second row shows the voltages of each rail. Each rail can be shown by clicking on it. If you want to see all rails at the same time you just click the All ("Alle") button on the lower right side of this row. A second screen will open and show all rails and their respective voltages. We compared the voltage on each rail with our equipment and found the results were quite similar. The differences were in the millivolt range and not more (i.e. less than .01V).
The third row shows the actual power drawn on each rail. By clicking on each rail the load can be seen in the little round display on the right side. The upper amount shows the actual used power on the chosen rail and the lower amount shows the highest power drawn on that rail during the current session. The amounts shown were not been equal to the actual loads we had put on the rails. We measured differences of up to 10A. Bringing up the details display, we can see all rails at once. The display shows on all 12V rails with a maximum 18A which is not quite accurate since two of the rails are rated at 25A.


23 Comments
View All Comments
mostlyprudent - Tuesday, July 24, 2007 - link
Read the test methodology article.neogodless - Tuesday, July 24, 2007 - link
Did you find any issues with the modular design? Obviously the efficiency was good. Could anything else have been affected by the additional connection point?Christoph Katzer - Tuesday, July 24, 2007 - link
I am in the midle of testing that with other models. I will write something which will bring light in this in matter...