Hitachi Deskstar 7K1000: Terabyte Storage arrives on the Desktop
by Gary Key on March 19, 2007 8:00 AM EST- Posted in
- Storage
Actual Application Performance
Our application benchmarks are designed to show application performance results with times being reported in minutes / seconds or seconds only, with lower scores being better. Our graph engine does not allow for a time format such a 1:05 (one minute, five seconds) so this time value will be represented as 1.05. While these tests will show some differences between the drives it is important to understand we are no longer measuring the pure performance of the hard drive but how well our platform performs with each individual drive. The performance of a hard drive is an integral part of the computer platform but other factors such as memory, CPU, core logic, and even driver choice can play a major role in determining how well the hard drive performs in any given task. Also worth noting is that new features of Windows Vista - specifically SuperFetch - can further reduce the measured performance differences between hard drives.
Game Load Test
Our Sims 2 - Open for Business test measures the time it takes to load the initial portion of the game. Our application timer starts when the game icon is initiated until the neighborhood menu appears.
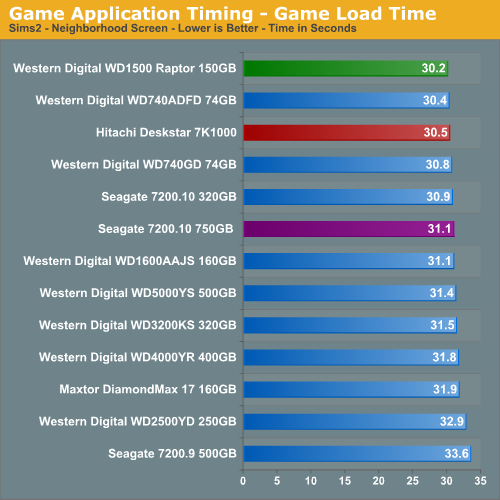
The results are basically the same as our IPEAK results as the WD Raptor series continues to lead all drives although the performance differences are not as drastic once we take into account the entire platform. We notice the Hitachi drive scoring better than the other 7200rpm drives and the drive seemed just as fast as the Raptors over the course of game play, something we generally did not find with our other top performing 7200rpm drives.
Game Level Load
This test centers on the actual loading of a playable level within our game selections. We run Battlefield 2 and measure the time it takes to load the Daqing Oilfields level. Our application timer begins when the start single player icon is initiated and ends when the join game icon is visible.
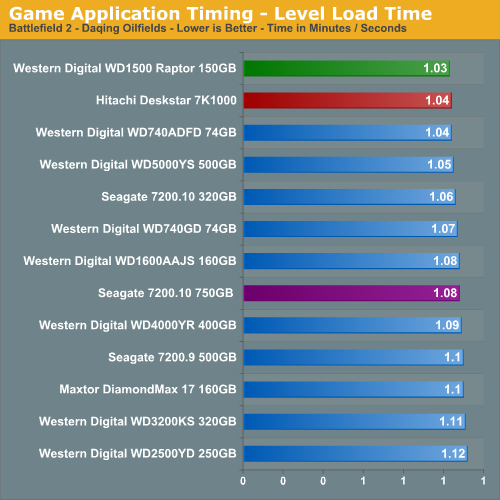
The WD1500ADFD Raptor continues its pattern of being the best available drive for the gaming enthusiast and our subjective opinion also matches the test scores although we are openly debating this statement now. Of course it is easy to debate our continued love affair with the Raptor as the difference in load times between the WD1500 and the 7K1000 drive was only one second so it appears we are getting close to finally having a Raptor killer in the large capacity 7200rpm drives. We firmly believe the areal density and 32 MB cache advantages of the Hitachi 7K1000 make up for the rotational and random access advantages of the Raptor in our gaming tests.
AnyDVD 5.9.6
Our next test has us utilizing the "ripping" function of AnyDVD to copy the Office Space DVD file from our source drive to our test drive. Our DVD features 29 files totaling 7.55GB of data and is an excellent test for determining the write speed of a drive.
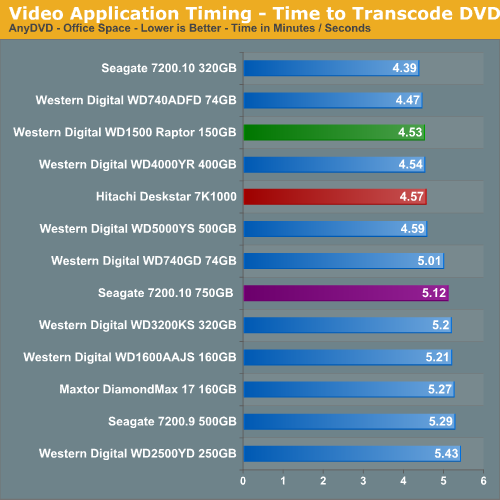
Our Seagate Barracuda 7200.10 320GB drive scores extremely well in this test due to exceptional read times with large data blocks in sequential order, something its larger sibling does not handle well. This is one of the few tests where our 7K1000 does not finish ahead of the other 7200rpm drives but it does improve upon its performance when compared to the IPEAK results. The 7K1000 still manages a top five finish while finishing 15 seconds ahead of the Seagate 750GB drive.
Nero Audio Encode
Our last test has us utilizing the audio encoding functions of Nero to convert our INXS Greatest Hits audio files in MP4 format to a high quality variable rate MP3 file for our portable player. Our test features 16 files totaling 137MB of data and is an excellent test for determining the read and write speed of a drive.
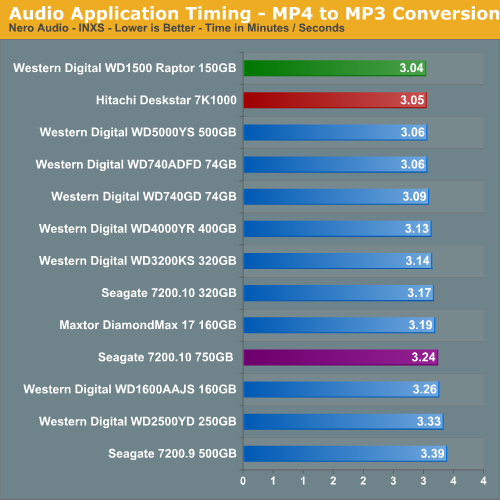
The test results show once again the amount of time a fast hard drive like the WD Raptor can save over the course of audio or video file manipulation session. In this case, the WD1500ADFD finishes just ahead of the 7K1000 where it handles small block sizes in sequential order slightly better due to is rotational speed advantage.
Our application benchmarks are designed to show application performance results with times being reported in minutes / seconds or seconds only, with lower scores being better. Our graph engine does not allow for a time format such a 1:05 (one minute, five seconds) so this time value will be represented as 1.05. While these tests will show some differences between the drives it is important to understand we are no longer measuring the pure performance of the hard drive but how well our platform performs with each individual drive. The performance of a hard drive is an integral part of the computer platform but other factors such as memory, CPU, core logic, and even driver choice can play a major role in determining how well the hard drive performs in any given task. Also worth noting is that new features of Windows Vista - specifically SuperFetch - can further reduce the measured performance differences between hard drives.
Game Load Test
Our Sims 2 - Open for Business test measures the time it takes to load the initial portion of the game. Our application timer starts when the game icon is initiated until the neighborhood menu appears.
The results are basically the same as our IPEAK results as the WD Raptor series continues to lead all drives although the performance differences are not as drastic once we take into account the entire platform. We notice the Hitachi drive scoring better than the other 7200rpm drives and the drive seemed just as fast as the Raptors over the course of game play, something we generally did not find with our other top performing 7200rpm drives.
Game Level Load
This test centers on the actual loading of a playable level within our game selections. We run Battlefield 2 and measure the time it takes to load the Daqing Oilfields level. Our application timer begins when the start single player icon is initiated and ends when the join game icon is visible.
The WD1500ADFD Raptor continues its pattern of being the best available drive for the gaming enthusiast and our subjective opinion also matches the test scores although we are openly debating this statement now. Of course it is easy to debate our continued love affair with the Raptor as the difference in load times between the WD1500 and the 7K1000 drive was only one second so it appears we are getting close to finally having a Raptor killer in the large capacity 7200rpm drives. We firmly believe the areal density and 32 MB cache advantages of the Hitachi 7K1000 make up for the rotational and random access advantages of the Raptor in our gaming tests.
AnyDVD 5.9.6
Our next test has us utilizing the "ripping" function of AnyDVD to copy the Office Space DVD file from our source drive to our test drive. Our DVD features 29 files totaling 7.55GB of data and is an excellent test for determining the write speed of a drive.
Our Seagate Barracuda 7200.10 320GB drive scores extremely well in this test due to exceptional read times with large data blocks in sequential order, something its larger sibling does not handle well. This is one of the few tests where our 7K1000 does not finish ahead of the other 7200rpm drives but it does improve upon its performance when compared to the IPEAK results. The 7K1000 still manages a top five finish while finishing 15 seconds ahead of the Seagate 750GB drive.
Nero Audio Encode
Our last test has us utilizing the audio encoding functions of Nero to convert our INXS Greatest Hits audio files in MP4 format to a high quality variable rate MP3 file for our portable player. Our test features 16 files totaling 137MB of data and is an excellent test for determining the read and write speed of a drive.
The test results show once again the amount of time a fast hard drive like the WD Raptor can save over the course of audio or video file manipulation session. In this case, the WD1500ADFD finishes just ahead of the 7K1000 where it handles small block sizes in sequential order slightly better due to is rotational speed advantage.


74 Comments
View All Comments
goldfish2 - Tuesday, March 20, 2007 - link
just noticed a problem you may wish to address with your charts, hope this hasn't already been mentioned.Take a look at the chart 'video application timing - time to transcode DVD'
Your times are in Minutes/seconds, it seems you're chart application has interpreted the numbers as decimals, and made the bar lengths on this basis. Take a look at the bar for WD5000YS 500GB. It says 4.59; I assume this means 4 minutes 59 seconds, making the WD740GD 2 seconds slower at 5 minutes 1 second. But the bar lengths are scaled for decimal, so that the bar on the WD740GD is much longer. You'll have to see if you can get your graph package to think in minutes:seconds, or have the bar lengths entered in decimal (i.e. 4:30 seconds becomes 4.5 minutes) and put a label on in minutes for readability.
Thanks for the review though.
Gary Key - Tuesday, March 20, 2007 - link
We have a short blurb under the Application Performance section -"Our application benchmarks are designed to show application performance results with times being reported in minutes / seconds or seconds only, with lower scores being better. Our graph engine does not allow for a time format such a 1:05 (one minute, five seconds) so this time value will be represented as 1.05."
We know this is an issue and hopefully we can address it in our next engine update (coming soon from what I understand). I had used percentage values in a previous article that was also confusing to some degree. Thanks for the comments and they have been passed on to our web team. ;)
PrinceGaz - Tuesday, March 20, 2007 - link
The simplest and most logical solution is just to enter the time in seconds, rather than minutes and seconds; even if graphed correctly, comparing values composed of two units (minutes:seconds) is difficult compared to a single unit (seconds).If two results were 6:47 and 7:04 for instance, the difference betweem them is much clearer if you say 407 and 424 seconds. By giving the value in seconds only, you can see at a glance that there is a 17 second difference, which translates to just over 4% (17 divided by 407/100, or 17 divided by about 4.1).
Doing the same mental calculation with 6:47 and 7:04 first involves working out the difference with the extra step of dealing with 60 seconds to a minute. Then you have a difference of 17 seconds out of a little under 7 minutes, which isn't very helpful until you convert the 7 minutes to seconds, as it should have been originally.
That's my opinion anyway.
JarredWalton - Tuesday, March 20, 2007 - link
Hi Gary. I told you so! Damned if you do, damned if you don't. ;) (The rest of you can just ignore me.)PrinceGaz - Tuesday, March 20, 2007 - link
How can you say only two years?
The 14 years you say it took to increase from 1GB to 500GB represents a doubling of capacity nine times, or roughly 1.56 years (19 months) for the capacity to double. That means that the two years (actually 20 months as Hitachi released a 500GB drive in Jul 2005) it took to double again, from 500GB to 1TB is actually marginally longer than average.
It would be more accurate to say that the trend of capacities doubling roughly every 18 months is continuing.
patentman - Tuesday, March 20, 2007 - link
The two year remark is two years from the first commercial perpendicular recording drive. Perpendicular recording has been in the works for a long time. In fact, when I used to examine patent applications for a living, there was patent literature related to perpendicular recording all the way back in 1990-1991, albeit for relatively simple aspects of the device.Gary Key - Tuesday, March 20, 2007 - link
The averaging of the time periods does work out to a doubling of capacities every 18~20 months but the last doubling took about 26 months to go from 250GB to 500GB.
mino - Wednesday, March 21, 2007 - link
Yes, but first 250GB drives were 4-platter 5400rpm ones(Maxtor?)...First 500GB were 5-platter 7200rpm ones.
IMO there are little dicrepancies in the tren dcaused bu the worry of many-platter drives after 75GXP. Aftre a few years Hitachi came back with 7K400 and the curve just returned to values it lost before...
scott967 - Tuesday, March 20, 2007 - link
On these big drives is NTFS performance an issue at all?scott s.
.
AbRASiON - Monday, March 19, 2007 - link
Too slow, too much money, too little space.I've owned 3 and sold them.
When are we going to see a 15krpm Savvio 2.5" review?
When will we see a 180gb per platter 32mb 10,000rpm new series raptor?
Maybe WD should also make a 15krpm 2.5" - 32mb model
These incrimental speed upgrades on hard disks are terrible :( need more, much much more.