Hitachi Deskstar 7K1000: Terabyte Storage arrives on the Desktop
by Gary Key on March 19, 2007 8:00 AM EST- Posted in
- Storage
iPeak Video/Audio Tests
The iPeak based Video/Audio benchmarks are designed around simulating media encoding and HTPC activities. These are basic benchmarks at this time as this section will be expanded once we start testing under Vista. Our change to a dual core processor will assist us in maintaining a balance between the CPU and Storage systems during the trace file creation and benchmarking processes. These benchmarks are CPU intensive in nature but also require a balanced storage system with the ability to handle read and write requests simultaneously in a very efficient manner.
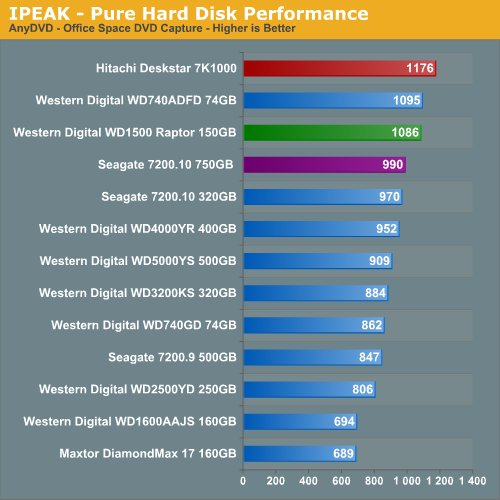
The AnyDVD benchmark is heavily weighted to write requests with the results showing a common pattern with the two 16MB cache Raptors finishing second and third with the 7K1000 once again showing its strength in the write intensive benchmarks due to its areal density and large cache design. We found the Seagate 750GB was pausing during streamed writes due to the smaller cache size after witnessing buffer overruns in the trace file when compared to the Hitachi drive.
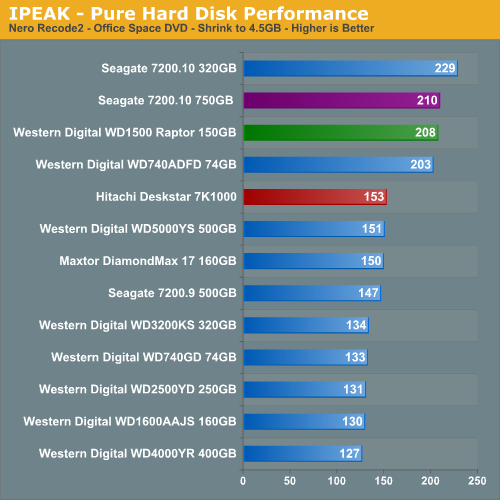
The NeroRecode 2 benchmark is weighted to streaming read requests but is balanced by continuous write operations near the end of the test. This benchmark is one of the most demanding ones in our test suite with the disk being active the entire trace file with several 100% utilization peaks. The results surprised us as we expected the Hitachi with its 32 MB cache and high sustained transfer rates to handle this benchmark with aplomb.
However, it turns out after reviewing the trace file results it was obvious that the 7K1000 was hampered by its inability to process large data blocks in sequential order efficiently as it had a number of buffer overruns during the read portion of the tests. This indicates to us the drive firmware is probably tuned more for non-sequential read/writes as the rest of our tests indicate. However, the 32 MB cache should have easily compensated for any potential large block issues in this test and the drive handled previous read heavy request tests with ease. Our initial test results with AAM off only show a two point advantage in this test. We are currently completing tests with AAM/NCQ off and will update the article if there are any noticeable performance differences.
iPeak Game Installation Tests
Our iPeak based Game Installation benchmarks simply show the ability of the hard drive to write data as quickly as possible to the disc based upon the installation software instructions. As detailed in our iPeak setup description we installed the games from our source drive in order to eliminate the optical drive bottleneck. In separate application timing we witnessed basically the same percentage spread when installing the games via our DVD drive so these results are representative of actual installation performance.
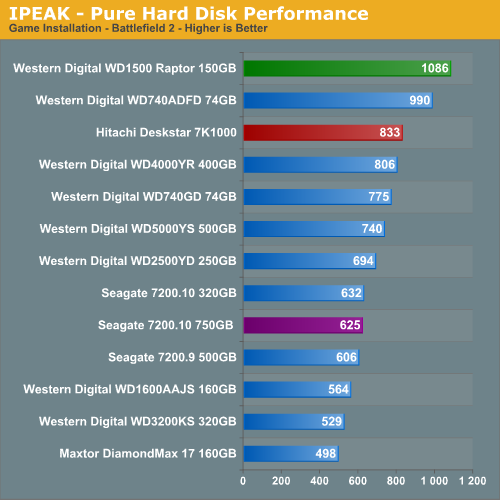
The Raptors once again finish at or near the top in our gaming tests due to their rotational and random access speeds. Our 7K1000 drive finishes ahead of the 7200rpm drives with a great deal of benefit going to the 32 MB cache and high sustained transfer rates. A review of the trace files did not indicate any real standout issues with the Seagate 750GB drive although we noticed several minor dips in performance when the drive was reading information off the source drive. The write performance was generally slower than the 7K1000 in this test and follow previous benchmark results.
We need to remember these tests reflect pure hard drive performance and will be mitigated by the overall system platform as we will see in our application tests. These tests are basically designed around continual read/write requests that favor large cache sizes, properly tuned firmware, and high sustained transfer rates.
iPeak Game Play Tests
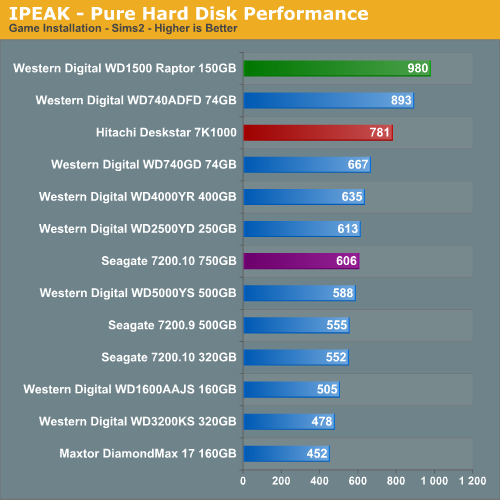
The iPeak based Game Play tests are centered on the benefits of having a hard disk that can load non-linear or sequential data files quickly without interrupting the flow of the game.
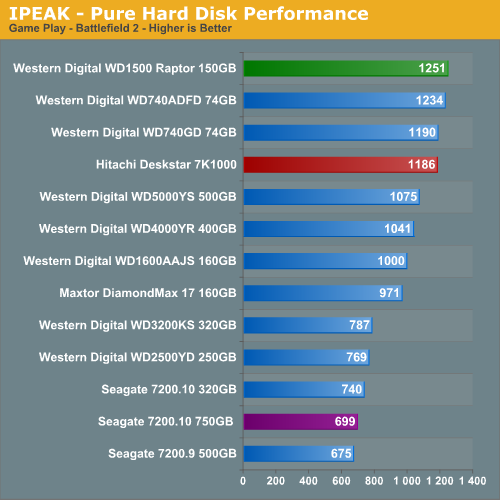
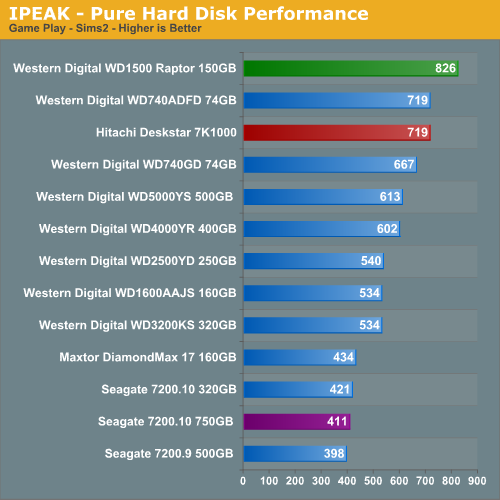
When it comes to gaming the Raptors rule but the 7K1000 is not that far behind with a second place tie in the disk intensive Sims2 and a strong fourth place finish in Battlefield 2. Although we are looking at pure performance results, in subjective testing we finally have a 7200rpm drive that "feels" as fast as the Raptor family of drives when loading or playing a game. The best overall gaming performance in a drive with a SATA interface is still the Raptors but considering the storage size, acoustic, and cost per-Gigabyte advantages of the Hitachi drive we are heavily leaning towards changing our recommendation.
The iPeak based Video/Audio benchmarks are designed around simulating media encoding and HTPC activities. These are basic benchmarks at this time as this section will be expanded once we start testing under Vista. Our change to a dual core processor will assist us in maintaining a balance between the CPU and Storage systems during the trace file creation and benchmarking processes. These benchmarks are CPU intensive in nature but also require a balanced storage system with the ability to handle read and write requests simultaneously in a very efficient manner.
The AnyDVD benchmark is heavily weighted to write requests with the results showing a common pattern with the two 16MB cache Raptors finishing second and third with the 7K1000 once again showing its strength in the write intensive benchmarks due to its areal density and large cache design. We found the Seagate 750GB was pausing during streamed writes due to the smaller cache size after witnessing buffer overruns in the trace file when compared to the Hitachi drive.
The NeroRecode 2 benchmark is weighted to streaming read requests but is balanced by continuous write operations near the end of the test. This benchmark is one of the most demanding ones in our test suite with the disk being active the entire trace file with several 100% utilization peaks. The results surprised us as we expected the Hitachi with its 32 MB cache and high sustained transfer rates to handle this benchmark with aplomb.
However, it turns out after reviewing the trace file results it was obvious that the 7K1000 was hampered by its inability to process large data blocks in sequential order efficiently as it had a number of buffer overruns during the read portion of the tests. This indicates to us the drive firmware is probably tuned more for non-sequential read/writes as the rest of our tests indicate. However, the 32 MB cache should have easily compensated for any potential large block issues in this test and the drive handled previous read heavy request tests with ease. Our initial test results with AAM off only show a two point advantage in this test. We are currently completing tests with AAM/NCQ off and will update the article if there are any noticeable performance differences.
iPeak Game Installation Tests
Our iPeak based Game Installation benchmarks simply show the ability of the hard drive to write data as quickly as possible to the disc based upon the installation software instructions. As detailed in our iPeak setup description we installed the games from our source drive in order to eliminate the optical drive bottleneck. In separate application timing we witnessed basically the same percentage spread when installing the games via our DVD drive so these results are representative of actual installation performance.
The Raptors once again finish at or near the top in our gaming tests due to their rotational and random access speeds. Our 7K1000 drive finishes ahead of the 7200rpm drives with a great deal of benefit going to the 32 MB cache and high sustained transfer rates. A review of the trace files did not indicate any real standout issues with the Seagate 750GB drive although we noticed several minor dips in performance when the drive was reading information off the source drive. The write performance was generally slower than the 7K1000 in this test and follow previous benchmark results.
We need to remember these tests reflect pure hard drive performance and will be mitigated by the overall system platform as we will see in our application tests. These tests are basically designed around continual read/write requests that favor large cache sizes, properly tuned firmware, and high sustained transfer rates.
iPeak Game Play Tests
The iPeak based Game Play tests are centered on the benefits of having a hard disk that can load non-linear or sequential data files quickly without interrupting the flow of the game.
When it comes to gaming the Raptors rule but the 7K1000 is not that far behind with a second place tie in the disk intensive Sims2 and a strong fourth place finish in Battlefield 2. Although we are looking at pure performance results, in subjective testing we finally have a 7200rpm drive that "feels" as fast as the Raptor family of drives when loading or playing a game. The best overall gaming performance in a drive with a SATA interface is still the Raptors but considering the storage size, acoustic, and cost per-Gigabyte advantages of the Hitachi drive we are heavily leaning towards changing our recommendation.


74 Comments
View All Comments
goldfish2 - Tuesday, March 20, 2007 - link
just noticed a problem you may wish to address with your charts, hope this hasn't already been mentioned.Take a look at the chart 'video application timing - time to transcode DVD'
Your times are in Minutes/seconds, it seems you're chart application has interpreted the numbers as decimals, and made the bar lengths on this basis. Take a look at the bar for WD5000YS 500GB. It says 4.59; I assume this means 4 minutes 59 seconds, making the WD740GD 2 seconds slower at 5 minutes 1 second. But the bar lengths are scaled for decimal, so that the bar on the WD740GD is much longer. You'll have to see if you can get your graph package to think in minutes:seconds, or have the bar lengths entered in decimal (i.e. 4:30 seconds becomes 4.5 minutes) and put a label on in minutes for readability.
Thanks for the review though.
Gary Key - Tuesday, March 20, 2007 - link
We have a short blurb under the Application Performance section -"Our application benchmarks are designed to show application performance results with times being reported in minutes / seconds or seconds only, with lower scores being better. Our graph engine does not allow for a time format such a 1:05 (one minute, five seconds) so this time value will be represented as 1.05."
We know this is an issue and hopefully we can address it in our next engine update (coming soon from what I understand). I had used percentage values in a previous article that was also confusing to some degree. Thanks for the comments and they have been passed on to our web team. ;)
PrinceGaz - Tuesday, March 20, 2007 - link
The simplest and most logical solution is just to enter the time in seconds, rather than minutes and seconds; even if graphed correctly, comparing values composed of two units (minutes:seconds) is difficult compared to a single unit (seconds).If two results were 6:47 and 7:04 for instance, the difference betweem them is much clearer if you say 407 and 424 seconds. By giving the value in seconds only, you can see at a glance that there is a 17 second difference, which translates to just over 4% (17 divided by 407/100, or 17 divided by about 4.1).
Doing the same mental calculation with 6:47 and 7:04 first involves working out the difference with the extra step of dealing with 60 seconds to a minute. Then you have a difference of 17 seconds out of a little under 7 minutes, which isn't very helpful until you convert the 7 minutes to seconds, as it should have been originally.
That's my opinion anyway.
JarredWalton - Tuesday, March 20, 2007 - link
Hi Gary. I told you so! Damned if you do, damned if you don't. ;) (The rest of you can just ignore me.)PrinceGaz - Tuesday, March 20, 2007 - link
How can you say only two years?
The 14 years you say it took to increase from 1GB to 500GB represents a doubling of capacity nine times, or roughly 1.56 years (19 months) for the capacity to double. That means that the two years (actually 20 months as Hitachi released a 500GB drive in Jul 2005) it took to double again, from 500GB to 1TB is actually marginally longer than average.
It would be more accurate to say that the trend of capacities doubling roughly every 18 months is continuing.
patentman - Tuesday, March 20, 2007 - link
The two year remark is two years from the first commercial perpendicular recording drive. Perpendicular recording has been in the works for a long time. In fact, when I used to examine patent applications for a living, there was patent literature related to perpendicular recording all the way back in 1990-1991, albeit for relatively simple aspects of the device.Gary Key - Tuesday, March 20, 2007 - link
The averaging of the time periods does work out to a doubling of capacities every 18~20 months but the last doubling took about 26 months to go from 250GB to 500GB.
mino - Wednesday, March 21, 2007 - link
Yes, but first 250GB drives were 4-platter 5400rpm ones(Maxtor?)...First 500GB were 5-platter 7200rpm ones.
IMO there are little dicrepancies in the tren dcaused bu the worry of many-platter drives after 75GXP. Aftre a few years Hitachi came back with 7K400 and the curve just returned to values it lost before...
scott967 - Tuesday, March 20, 2007 - link
On these big drives is NTFS performance an issue at all?scott s.
.
AbRASiON - Monday, March 19, 2007 - link
Too slow, too much money, too little space.I've owned 3 and sold them.
When are we going to see a 15krpm Savvio 2.5" review?
When will we see a 180gb per platter 32mb 10,000rpm new series raptor?
Maybe WD should also make a 15krpm 2.5" - 32mb model
These incrimental speed upgrades on hard disks are terrible :( need more, much much more.