Hitachi Deskstar 7K1000: Terabyte Storage arrives on the Desktop
by Gary Key on March 19, 2007 8:00 AM EST- Posted in
- Storage
PCMark05 Performance
We are utilizing the HDD test suite within PCMark05 for further comparative hard disk scores as it provides a mixture of actual application results and specific read/write percentages utilized within these programs. It is also a readily available benchmark that others can use for comparative purposes. The program utilizes the RankDisk application within the Intel iPeak SPT suite of tools to record a trace of disk activity during usage of real world applications. These traces are then replayed to generate performance measurements based upon the actual disk operations within each application. The HDD test suite contains 53% read and 47% write operations with each trace section utilizing varied amounts of read or write operations. Additional information about the test suite can be found in PDF format here PCMark05 whitepaper.
The PCMark05 test results are based upon the following trace runs:
Windows XP Startup: This test consists of 90% reading and 10% writes that tracks XP activities at start-up.
Application Loading: This test consists of 83% reading and 17% writes that tracks the opening and closing of the following programs.
File Write: This test consists of 100% write activities by writing 680MB of files onto the hard disk.
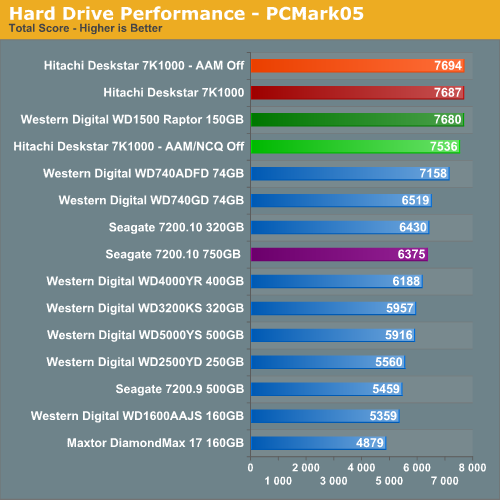
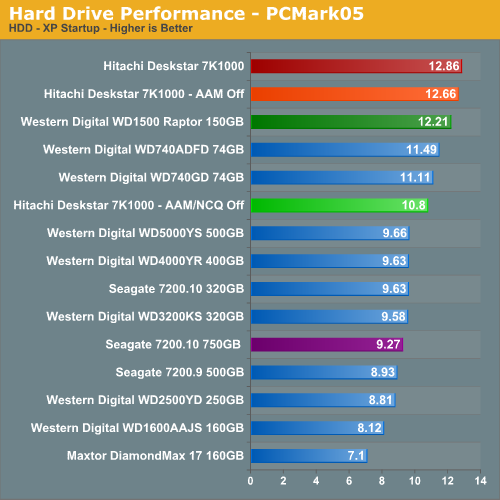
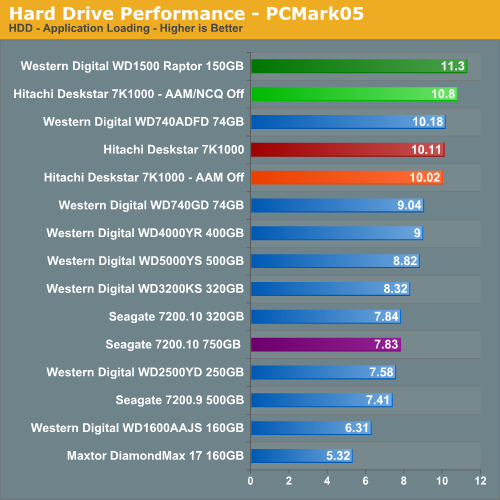
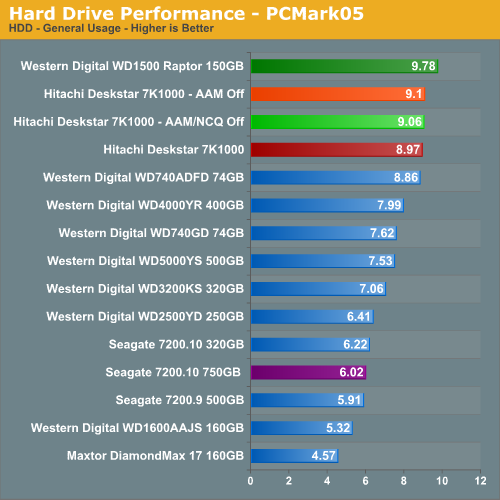
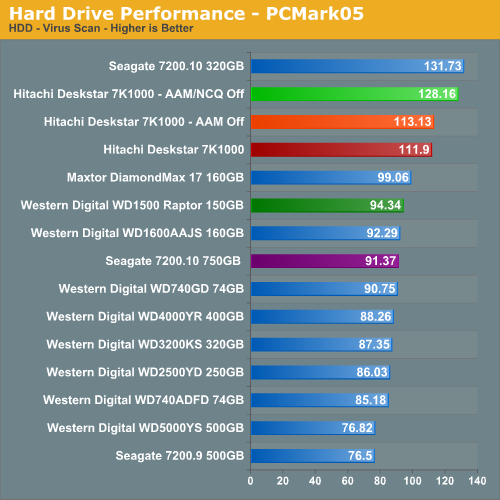
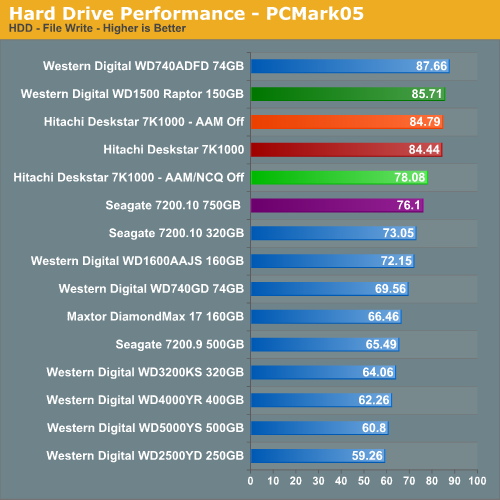
Our PCMark05 numbers surprised us with the 7K1000 scoring better than our previous champion, the WD 150GB Raptor. The performance delta between the 7K1000 and WD1500AHFD is minimal with the major differences occurring in the General Usage and Application sections of the test where combined write and read speeds favor the Raptor's rotational/access speeds while the 7K1000 scores extremely well in the Virus Scan tests especially when both AAM and NCQ are turned off.
We are providing test results with the 7K1000 in this series of benchmarks with AAM/NCQ on, AAM/NCQ off, and NCQ on only. The overall score goes to the NCQ only configuration but the AAM/NCQ on configuration only finishes 7 points behind. It was a toss up between the two configurations with the tests where read operations were prevalent benefiting the NCQ only setup. This is to be expected as random access times are about 30% slower with AAM on but it does not correlate to a noticeable difference in performance. This is one drive where you can have it quiet and fast at the same time. Our recommendation is to leave AAM and NCQ on unless you spend your day benchmarking virus scan programs.
We are utilizing the HDD test suite within PCMark05 for further comparative hard disk scores as it provides a mixture of actual application results and specific read/write percentages utilized within these programs. It is also a readily available benchmark that others can use for comparative purposes. The program utilizes the RankDisk application within the Intel iPeak SPT suite of tools to record a trace of disk activity during usage of real world applications. These traces are then replayed to generate performance measurements based upon the actual disk operations within each application. The HDD test suite contains 53% read and 47% write operations with each trace section utilizing varied amounts of read or write operations. Additional information about the test suite can be found in PDF format here PCMark05 whitepaper.
The PCMark05 test results are based upon the following trace runs:
Windows XP Startup: This test consists of 90% reading and 10% writes that tracks XP activities at start-up.
Application Loading: This test consists of 83% reading and 17% writes that tracks the opening and closing of the following programs.
- Microsoft Word
- Adobe Acrobat Reader
- Windows Media Player
- 3Dmark 2001SE
- Leadtek WinFast DVD
- Mozilla Internet Browser
- Opening a Microsoft Word document, performing grammar check, saving and closing
- Compression and decompression using WinZip
- Encrypting and decrypting a file using PowerCrypt
- Scanning files for viruses using F-Secure Antivirus
- Playing an MP3 file with Winamp
- Playing a WAV file with Winamp
- Playing a DivX video using the DivX codec and Windows Media Player
- Playing a WMV video file using Windows Media Player
- Viewing pictures using Windows Picture Viewer
- Browsing the Internet using Microsoft Internet Explorer
- Loading, playing and exiting a game with Tom Clancy's Ghost Recon
File Write: This test consists of 100% write activities by writing 680MB of files onto the hard disk.
Our PCMark05 numbers surprised us with the 7K1000 scoring better than our previous champion, the WD 150GB Raptor. The performance delta between the 7K1000 and WD1500AHFD is minimal with the major differences occurring in the General Usage and Application sections of the test where combined write and read speeds favor the Raptor's rotational/access speeds while the 7K1000 scores extremely well in the Virus Scan tests especially when both AAM and NCQ are turned off.
We are providing test results with the 7K1000 in this series of benchmarks with AAM/NCQ on, AAM/NCQ off, and NCQ on only. The overall score goes to the NCQ only configuration but the AAM/NCQ on configuration only finishes 7 points behind. It was a toss up between the two configurations with the tests where read operations were prevalent benefiting the NCQ only setup. This is to be expected as random access times are about 30% slower with AAM on but it does not correlate to a noticeable difference in performance. This is one drive where you can have it quiet and fast at the same time. Our recommendation is to leave AAM and NCQ on unless you spend your day benchmarking virus scan programs.


74 Comments
View All Comments
goldfish2 - Tuesday, March 20, 2007 - link
just noticed a problem you may wish to address with your charts, hope this hasn't already been mentioned.Take a look at the chart 'video application timing - time to transcode DVD'
Your times are in Minutes/seconds, it seems you're chart application has interpreted the numbers as decimals, and made the bar lengths on this basis. Take a look at the bar for WD5000YS 500GB. It says 4.59; I assume this means 4 minutes 59 seconds, making the WD740GD 2 seconds slower at 5 minutes 1 second. But the bar lengths are scaled for decimal, so that the bar on the WD740GD is much longer. You'll have to see if you can get your graph package to think in minutes:seconds, or have the bar lengths entered in decimal (i.e. 4:30 seconds becomes 4.5 minutes) and put a label on in minutes for readability.
Thanks for the review though.
Gary Key - Tuesday, March 20, 2007 - link
We have a short blurb under the Application Performance section -"Our application benchmarks are designed to show application performance results with times being reported in minutes / seconds or seconds only, with lower scores being better. Our graph engine does not allow for a time format such a 1:05 (one minute, five seconds) so this time value will be represented as 1.05."
We know this is an issue and hopefully we can address it in our next engine update (coming soon from what I understand). I had used percentage values in a previous article that was also confusing to some degree. Thanks for the comments and they have been passed on to our web team. ;)
PrinceGaz - Tuesday, March 20, 2007 - link
The simplest and most logical solution is just to enter the time in seconds, rather than minutes and seconds; even if graphed correctly, comparing values composed of two units (minutes:seconds) is difficult compared to a single unit (seconds).If two results were 6:47 and 7:04 for instance, the difference betweem them is much clearer if you say 407 and 424 seconds. By giving the value in seconds only, you can see at a glance that there is a 17 second difference, which translates to just over 4% (17 divided by 407/100, or 17 divided by about 4.1).
Doing the same mental calculation with 6:47 and 7:04 first involves working out the difference with the extra step of dealing with 60 seconds to a minute. Then you have a difference of 17 seconds out of a little under 7 minutes, which isn't very helpful until you convert the 7 minutes to seconds, as it should have been originally.
That's my opinion anyway.
JarredWalton - Tuesday, March 20, 2007 - link
Hi Gary. I told you so! Damned if you do, damned if you don't. ;) (The rest of you can just ignore me.)PrinceGaz - Tuesday, March 20, 2007 - link
How can you say only two years?
The 14 years you say it took to increase from 1GB to 500GB represents a doubling of capacity nine times, or roughly 1.56 years (19 months) for the capacity to double. That means that the two years (actually 20 months as Hitachi released a 500GB drive in Jul 2005) it took to double again, from 500GB to 1TB is actually marginally longer than average.
It would be more accurate to say that the trend of capacities doubling roughly every 18 months is continuing.
patentman - Tuesday, March 20, 2007 - link
The two year remark is two years from the first commercial perpendicular recording drive. Perpendicular recording has been in the works for a long time. In fact, when I used to examine patent applications for a living, there was patent literature related to perpendicular recording all the way back in 1990-1991, albeit for relatively simple aspects of the device.Gary Key - Tuesday, March 20, 2007 - link
The averaging of the time periods does work out to a doubling of capacities every 18~20 months but the last doubling took about 26 months to go from 250GB to 500GB.
mino - Wednesday, March 21, 2007 - link
Yes, but first 250GB drives were 4-platter 5400rpm ones(Maxtor?)...First 500GB were 5-platter 7200rpm ones.
IMO there are little dicrepancies in the tren dcaused bu the worry of many-platter drives after 75GXP. Aftre a few years Hitachi came back with 7K400 and the curve just returned to values it lost before...
scott967 - Tuesday, March 20, 2007 - link
On these big drives is NTFS performance an issue at all?scott s.
.
AbRASiON - Monday, March 19, 2007 - link
Too slow, too much money, too little space.I've owned 3 and sold them.
When are we going to see a 15krpm Savvio 2.5" review?
When will we see a 180gb per platter 32mb 10,000rpm new series raptor?
Maybe WD should also make a 15krpm 2.5" - 32mb model
These incrimental speed upgrades on hard disks are terrible :( need more, much much more.