Promise VTrak J300s
by Jason Clark & Dave Muysson on February 2, 2007 8:00 AM EST- Posted in
- IT Computing
Test results - Read Performance
100% Sequential Reads
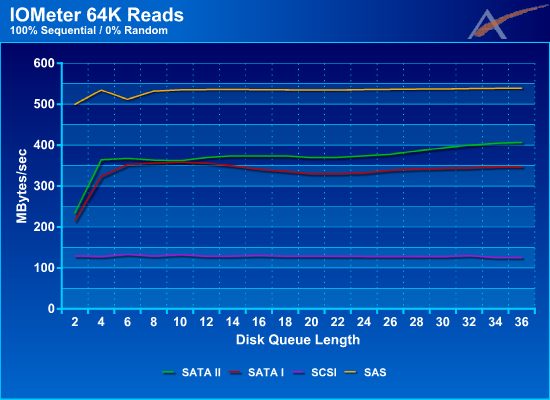
When we first gathered the test data together, we were very impressed with the results. Both SAS and SATA I/II show extremely high performance with 100% sequential accesses. The SCSI and SAS drives are similar in terms of capacity while the SAS drives offer higher rotational speeds. Meanwhile, the SATA drives are all 7200 RPM models, theoretically offering less performance but higher capacities than either of the other two solutions.
We can really see the benefit a point-to-point architecture has to offer, as well as the impact the shared bus has on performance. All of the SAS/SATA solutions offer much higher read performance than the SCSI offering here, which helps to explain why SAS solutions are rapidly increasing market share. SCSI Ultra320 can't even come near its theoretical 320 MB/s transfer rates due to sharing overhead. Strangely, we see SCSI and SATA I drop slightly as the DQL increases, while SAS and SATA II increase slightly.
It is interesting to note the performance at low Disk Queue Length between the different technologies. Both SAS and SCSI are very close to their peak performance even at a DQL of 2, whereas SATA needs a DQL of 4 before it starts performing well. As the Disk Queue Length increases, both SAS and SCSI hold their performance well, and a gap starts to emerge between SATA I and SATA II.
95% Sequential Reads
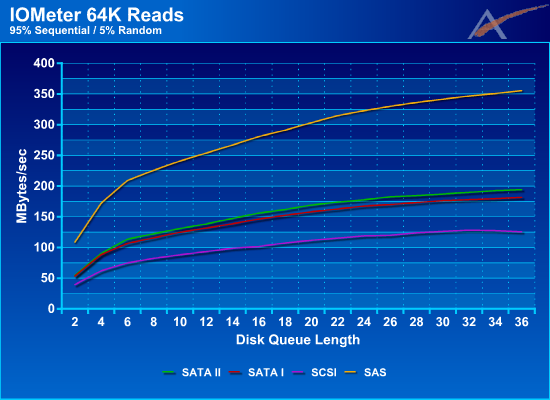
Here we start to see the impact that randomness has on our read performance. SAS is still in the lead but SCSI is starting to catch up to SATA I/II. The higher rotational speeds of SCSI and SAS solutions can help relative to most SATA offerings, as access times depend in part on rotational latency. Performance continues to grow through the whole range of Disk Queue Length with SAS breaking 350MB/sec around 34. This is significantly higher then the 175-200MB/Sec of SATA I/II and 125MB/Sec that SCSI is able to obtain.
Again, we see the benefit that the point-to-point architecture has to offer over the old shared bus architecture. SATA II maintains a slight lead over SATA I, but both don't even come close to touching SAS. SCSI gains ground, but given the maximum throughput of around 130 MB/s that was measured in the 100% sequential test, it still trails by a large margin in this workload.
80% Sequential Reads
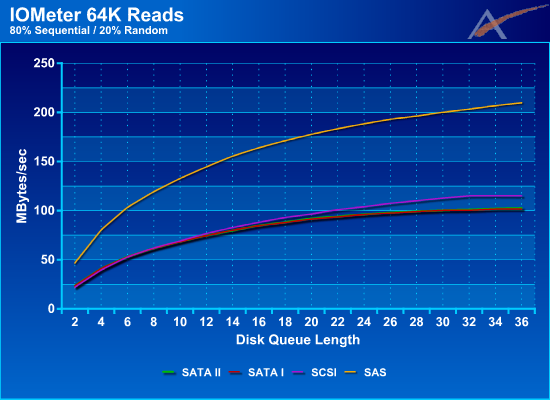
At 20% Random Reads we start to see SATA I/II losing its performance advantage over SCSI, while SAS clearly remains as the performance leader. We continue to see performance grow as the DQL increases, but it's interesting to see that SAS is ramping up faster then everyone else. SATA I and SATA II are struggling to keep up with SCSI which has now moved into second place. At this point, the performance of SATA I and SATA II are almost identical.
Random (0% Sequential) Reads
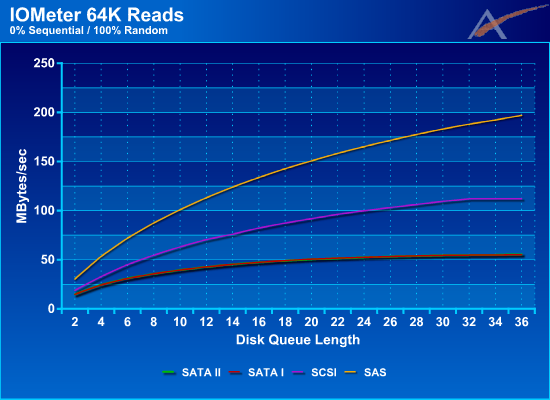
In the previous graphs we've seen the impact that random data has on our overall throughput. Now that we are at 100% Random accesses, we get to see how the drives perform in a 'worst-case' scenario. SAS continues to take the performance lead by throughput that's almost double that of SCSI, but now SCSI is almost twice as fast as SATA I/II. Looking at the results through the whole DQL range, SAS continues to grow without showing signs of slowing down, whereas SCSI and SATA I/II appear to level off around 32-36 DQL.
While a point-to-point architecture clearly has advantages with sequential accesses, there is still something to be said about spindle speed and disk firmware. However, given that SCSI maxed out at ~130 MB/s in the sequential testing, higher spindle speeds would only go so far in closing the gap between SCSI and SAS. SATA drives like Western Digital's 10K RPM Raptor should also be able to close the distance with SCSI in highly random usage scenarios.
We've covered the read performance, but what happens when we test writes?
100% Sequential Reads
| 100% Sequential Read Performance (MB/Sec) | |||
| 1 DQL/Disk | 2 DQL/Disk | 3 DQL/Disk | |
| SAS | 536 MB/sec | 536 MB/sec | 540 MB/sec |
| SATA II | 370 MB/sec | 374 MB/sec | 407 MB/sec |
| SATA I | 356 MB/sec | 333 MB/sec | 348 MB/sec |
| SCSI | 129 MB/sec | 128 MB/sec | 126 MB/sec |
When we first gathered the test data together, we were very impressed with the results. Both SAS and SATA I/II show extremely high performance with 100% sequential accesses. The SCSI and SAS drives are similar in terms of capacity while the SAS drives offer higher rotational speeds. Meanwhile, the SATA drives are all 7200 RPM models, theoretically offering less performance but higher capacities than either of the other two solutions.
We can really see the benefit a point-to-point architecture has to offer, as well as the impact the shared bus has on performance. All of the SAS/SATA solutions offer much higher read performance than the SCSI offering here, which helps to explain why SAS solutions are rapidly increasing market share. SCSI Ultra320 can't even come near its theoretical 320 MB/s transfer rates due to sharing overhead. Strangely, we see SCSI and SATA I drop slightly as the DQL increases, while SAS and SATA II increase slightly.
It is interesting to note the performance at low Disk Queue Length between the different technologies. Both SAS and SCSI are very close to their peak performance even at a DQL of 2, whereas SATA needs a DQL of 4 before it starts performing well. As the Disk Queue Length increases, both SAS and SCSI hold their performance well, and a gap starts to emerge between SATA I and SATA II.
95% Sequential Reads
| 95% Sequential Read Performance (MB/Sec) | |||
| 1 DQL/Disk | 2 DQL/Disk | 3 DQL/Disk | |
| SAS | 254 MB/sec | 323 MB/sec | 356 MB/sec |
| SATA II | 138 MB/sec | 178 MB/sec | 194 MB/sec |
| SATA I | 132 MB/sec | 167 MB/sec | 182 MB/sec |
| SCSI | 93 MB/sec | 119 MB/sec | 126 MB/sec |
Here we start to see the impact that randomness has on our read performance. SAS is still in the lead but SCSI is starting to catch up to SATA I/II. The higher rotational speeds of SCSI and SAS solutions can help relative to most SATA offerings, as access times depend in part on rotational latency. Performance continues to grow through the whole range of Disk Queue Length with SAS breaking 350MB/sec around 34. This is significantly higher then the 175-200MB/Sec of SATA I/II and 125MB/Sec that SCSI is able to obtain.
Again, we see the benefit that the point-to-point architecture has to offer over the old shared bus architecture. SATA II maintains a slight lead over SATA I, but both don't even come close to touching SAS. SCSI gains ground, but given the maximum throughput of around 130 MB/s that was measured in the 100% sequential test, it still trails by a large margin in this workload.
80% Sequential Reads
| 80% Sequential Read Performance (MB/Sec) | |||
| 1 DQL/Disk | 2 DQL/Disk | 3 DQL/Disk | |
| SAS | 144 MB/sec | 188 MB/sec | 210 MB/sec |
| SATA II | 75 MB/sec | 96 MB/sec | 103 MB/sec |
| SATA I | 74 MB/sec | 96 MB/sec | 102 MB/sec |
| SCSI | 77 MB/sec | 104 MB/sec | 115 MB/sec |
At 20% Random Reads we start to see SATA I/II losing its performance advantage over SCSI, while SAS clearly remains as the performance leader. We continue to see performance grow as the DQL increases, but it's interesting to see that SAS is ramping up faster then everyone else. SATA I and SATA II are struggling to keep up with SCSI which has now moved into second place. At this point, the performance of SATA I and SATA II are almost identical.
Random (0% Sequential) Reads
| Random Read Performance (MB/Sec) | |||
| 1 DQL/Disk | 2 DQL/Disk | 3 DQL/Disk | |
| SAS | 113 MB/sec | 165 MB/sec | 197 MB/sec |
| SATA II | 43 MB/sec | 53 MB/sec | 56 MB/sec |
| SATA I | 43 MB/sec | 53 MB/sec | 55 MB/sec |
| SCSI | 70 MB/sec | 100 MB/sec | 112 MB/sec |
In the previous graphs we've seen the impact that random data has on our overall throughput. Now that we are at 100% Random accesses, we get to see how the drives perform in a 'worst-case' scenario. SAS continues to take the performance lead by throughput that's almost double that of SCSI, but now SCSI is almost twice as fast as SATA I/II. Looking at the results through the whole DQL range, SAS continues to grow without showing signs of slowing down, whereas SCSI and SATA I/II appear to level off around 32-36 DQL.
While a point-to-point architecture clearly has advantages with sequential accesses, there is still something to be said about spindle speed and disk firmware. However, given that SCSI maxed out at ~130 MB/s in the sequential testing, higher spindle speeds would only go so far in closing the gap between SCSI and SAS. SATA drives like Western Digital's 10K RPM Raptor should also be able to close the distance with SCSI in highly random usage scenarios.
We've covered the read performance, but what happens when we test writes?


31 Comments
View All Comments
shady28 - Sunday, February 4, 2007 - link
Here are some graphs the author should look at :http://www.storagereview.com/articles/200609/ST330...">http://www.storagereview.com/articles/200609/ST330...
http://www.storagereview.com/articles/200601/250_i...">http://www.storagereview.com/articles/200601/250_i...