Promise VTrak J300s
by Jason Clark & Dave Muysson on February 2, 2007 8:00 AM EST- Posted in
- IT Computing
Test results - Write Performance
100% Sequential Writes
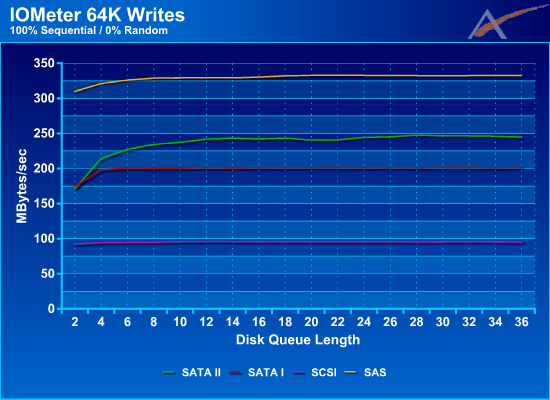
Using 100% sequential writes we get to see what the 'best-case' is for overall write throughput. SAS has once again taken the lead achieving over 325MB/sec, SCSI falls behind but maintains a solid rate almost reading 100MB/sec, but SATA I/II has a different story to tell. While starting out very close to one another, SATA II quickly jumps ahead of SATA I by almost 50MB/sec and maintains that lead throughout the DQL range. This may be the result of having 16MB of disk cache on the SATA II drives vs. the 8MB cache on SATA I. It will be interesting to see what impact this has as we introduce random access into the tests.
It's worth noting that maximum write performance is substantially lower than maximum read performance. All of the tested drives are at least 20% slower. There is some logic to this, however, as typical storage usage tends to be far more write heavy than read heavy, so optimizing for better read performance makes sense.
95% Sequential Writes
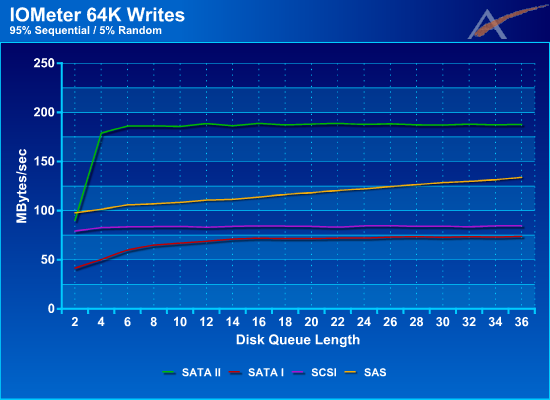
Now this was very surprising. SATA II has jumped ahead of everyone else and is leading at almost 180MB/sec from a DQL of 6 to 36, whereas SAS is struggling to reach 140MB/sec by the time it gets to a DQL of 36. Both SCSI and SATA I maintain a sub 100MB/sec performance with SATA I being slightly lower then SCSI. This created a lot of discussion inside our team that lead to a lot of testing and retesting of the drives. The results you see here are accurate and reflect what we were able to achieve with IOMeter.
Let's step back for a minute and go back to the 64K Read graphs. If we look at the impact adding 5% random access had to reads, SAS dropped 34%, SATA I 48%, SATA II 52%, and SCSI 0%. When we look at 64K Writes with 5% random access, SAS drops 60%, SATA I 63%, SATA II 23%, and SCSI 11%. We continue to see a significant drop with writes as we did with reads, though SATA II clearly has an advantage with writes.
It appears then that the 16MB cache on the SATA II drives is reducing the performance impact random access has to overall write throughput. Since reads must come right from the platters, this extra cache won't really be that advantageous to reads. Also, the SATA II drive has NCQ, but so do SAS and SCSI. NCQ should only bring us closer to SAS/SCSI but not surpass them. Since writes can be cached and could benefit from a larger cache, this is the only difference we could find that explains the high SATA II performance.
As the data stream becomes more and more random, the advantage the extra cache gives SATA II drives should be reduced since it won't be able to flush the data from cache to the disk as quickly as with 95% sequential writes. Let's find out with empirical testing, though.
80% Sequential Writes
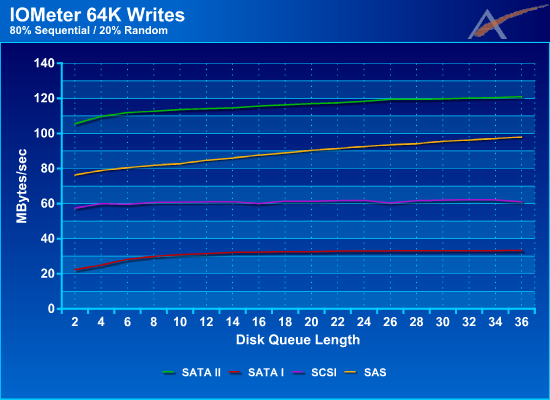
In this graph we start to see SAS catching up to SATA II. It appears the advantage SATA II had with the extra cache is starting to decrease as the access type becomes more random. SCSI holds fairly steady around the 60MB/sec mark while SATA I drops far behind everyone else.
Random (0% Sequential) Writes
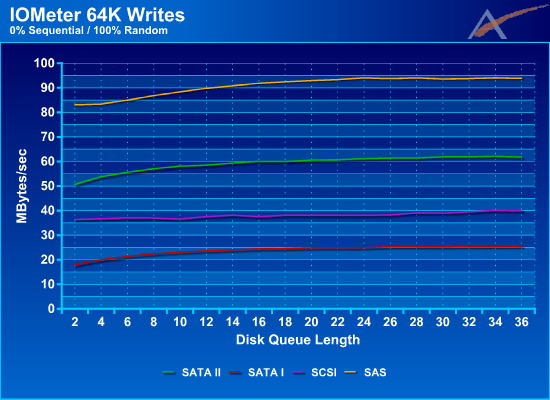
Now we see our 'worst-case' scenario, 100% random writes. SAS takes back the lead at 94MB/sec which is rather impressive when you consider it was at 98MB/sec @ 20% random. SATA II is in second place at 62MB/sec, which translates into a 50% drop from the last test. SCSI maintains third place at 40MB/sec, and SATA stays in last place at 25MB/sec.
Again, spindle speeds of the various offerings could help improve performance, but only to a certain extent. Additional cache is also clearly beneficial, as SATA maintains a strong second place showing. There's still a lot to think about, however, so let's take a look at the overall picture.
100% Sequential Writes
| 100% Sequential Write Performance (MB/Sec) | |||
| 1 DQL/Disk | 2 DQL/Disk | 3 DQL/Disk | |
| SAS | 329 MB/sec | 333 MB/sec | 333 MB/sec |
| SATA II | 242 MB/sec | 245 MB/sec | 245 MB/sec |
| SATA I | 201 MB/sec | 201 MB/sec | 202 MB/sec |
| SCSI | 96 MB/sec | 96 MB/sec | 95 MB/sec |
Using 100% sequential writes we get to see what the 'best-case' is for overall write throughput. SAS has once again taken the lead achieving over 325MB/sec, SCSI falls behind but maintains a solid rate almost reading 100MB/sec, but SATA I/II has a different story to tell. While starting out very close to one another, SATA II quickly jumps ahead of SATA I by almost 50MB/sec and maintains that lead throughout the DQL range. This may be the result of having 16MB of disk cache on the SATA II drives vs. the 8MB cache on SATA I. It will be interesting to see what impact this has as we introduce random access into the tests.
It's worth noting that maximum write performance is substantially lower than maximum read performance. All of the tested drives are at least 20% slower. There is some logic to this, however, as typical storage usage tends to be far more write heavy than read heavy, so optimizing for better read performance makes sense.
95% Sequential Writes
| 95% Sequential Write Performance (MB/Sec) | |||
| 1 DQL/Disk | 2 DQL/Disk | 3 DQL/Disk | |
| SAS | 111 MB/sec | 122 MB/sec | 134 MB/sec |
| SATA II | 189 MB/sec | 188 MB/sec | 188 MB/sec |
| SATA I | 69 MB/sec | 72 MB/sec | 74 MB/sec |
| SCSI | 83 MB/sec | 85 MB/sec | 84 MB/sec |
Now this was very surprising. SATA II has jumped ahead of everyone else and is leading at almost 180MB/sec from a DQL of 6 to 36, whereas SAS is struggling to reach 140MB/sec by the time it gets to a DQL of 36. Both SCSI and SATA I maintain a sub 100MB/sec performance with SATA I being slightly lower then SCSI. This created a lot of discussion inside our team that lead to a lot of testing and retesting of the drives. The results you see here are accurate and reflect what we were able to achieve with IOMeter.
Let's step back for a minute and go back to the 64K Read graphs. If we look at the impact adding 5% random access had to reads, SAS dropped 34%, SATA I 48%, SATA II 52%, and SCSI 0%. When we look at 64K Writes with 5% random access, SAS drops 60%, SATA I 63%, SATA II 23%, and SCSI 11%. We continue to see a significant drop with writes as we did with reads, though SATA II clearly has an advantage with writes.
It appears then that the 16MB cache on the SATA II drives is reducing the performance impact random access has to overall write throughput. Since reads must come right from the platters, this extra cache won't really be that advantageous to reads. Also, the SATA II drive has NCQ, but so do SAS and SCSI. NCQ should only bring us closer to SAS/SCSI but not surpass them. Since writes can be cached and could benefit from a larger cache, this is the only difference we could find that explains the high SATA II performance.
As the data stream becomes more and more random, the advantage the extra cache gives SATA II drives should be reduced since it won't be able to flush the data from cache to the disk as quickly as with 95% sequential writes. Let's find out with empirical testing, though.
80% Sequential Writes
| 80% Sequential Write Performance (MB/Sec) | |||
| 1 DQL/Disk | 2 DQL/Disk | 3 DQL/Disk | |
| SAS | 85 MB/sec | 93 MB/sec | 98 MB/sec |
| SATA II | 114 MB/sec | 118 MB/sec | 121 MB/sec |
| SATA I | 32 MB/sec | 33 MB/sec | 33 MB/sec |
| SCSI | 61 MB/sec | 62 MB/sec | 61 MB/sec |
In this graph we start to see SAS catching up to SATA II. It appears the advantage SATA II had with the extra cache is starting to decrease as the access type becomes more random. SCSI holds fairly steady around the 60MB/sec mark while SATA I drops far behind everyone else.
Random (0% Sequential) Writes
| Random Write Performance (MB/Sec) | |||
| 1 DQL/Disk | 2 DQL/Disk | 3 DQL/Disk | |
| SAS | 90 MB/sec | 94 MB/sec | 94 MB/sec |
| SATA II | 59 MB/sec | 61 MB/sec | 62 MB/sec |
| SATA I | 24 MB/sec | 25 MB/sec | 25 MB/sec |
| SCSI | 38 MB/sec | 38 MB/sec | 40 MB/sec |
Now we see our 'worst-case' scenario, 100% random writes. SAS takes back the lead at 94MB/sec which is rather impressive when you consider it was at 98MB/sec @ 20% random. SATA II is in second place at 62MB/sec, which translates into a 50% drop from the last test. SCSI maintains third place at 40MB/sec, and SATA stays in last place at 25MB/sec.
Again, spindle speeds of the various offerings could help improve performance, but only to a certain extent. Additional cache is also clearly beneficial, as SATA maintains a strong second place showing. There's still a lot to think about, however, so let's take a look at the overall picture.


31 Comments
View All Comments
shady28 - Sunday, February 4, 2007 - link
Here are some graphs the author should look at :http://www.storagereview.com/articles/200609/ST330...">http://www.storagereview.com/articles/200609/ST330...
http://www.storagereview.com/articles/200601/250_i...">http://www.storagereview.com/articles/200601/250_i...