Fall '06 NVIDIA GPU Refresh - Part I: GeForce 7900 GS
by Derek Wilson on September 6, 2006 9:00 AM EST- Posted in
- GPUs
The Elder Scrolls IV: Oblivion Performance
While it is disappointing that Oblivion doesn't have a built in benchmark, our FRAPS tests have proven to be fairly repeatable and very intensive on every part of a system. While these numbers will reflect real world playability of the game, please remember that our test system uses the fastest processor we could get our hands on. If a purchasing decision is to be made using Oblivion performance alone, please check out our two articles on the CPU and GPU performance of Oblivion. We have used the most graphically intensive benchmark in our suite, but the rest of the platform will make a difference. We can still easily demonstrate which graphics card is best for Oblivion even if our numbers don't translate to what our readers will see on their systems.
Running through the forest towards an Oblivion gate while fireballs fly by our head is a very graphically taxing benchmark. In order to run this benchmark, we have a saved game that we load and run through with FRAPS. To start the benchmark, we hit "q" which just runs forward, and start and stop FRAPS at predetermined points in the run. While not 100% identical each run, our benchmark scores are usually fairly close. We run the benchmark a couple times just to be sure there wasn't a one time hiccup.
As for settings, we tested a few different configurations and decided on this group of options:
| Oblivion Performance Settings | |
| Texture Size | Large |
| Tree Fade | 60% |
| Actor Fade | 20% |
| Item Fade | 10% |
| Object Fade | 25% |
| Grass Distance | 30% |
| View Distance | 100% |
| Distant Land | On |
| Distant Buildings | On |
| Distant Trees | On |
| Interior Shadows | 45% |
| Exterior Shadows | 20% |
| Self Shadows | Off |
| Shadows on Grass | Off |
| Tree Canopy Shadows | Off |
| Shadow Filtering | High |
| Specular Distance | 80% |
| HDR Lighting | On |
| Bloom Lighting | Off |
| Water Detail | Normal |
| Water Reflections | On |
| Water Ripples | On |
| Window Reflections | On |
| Blood Decals | High |
| Anti-aliasing | Off |
Our goal was to get acceptable performance levels under the current generation of cards at 1600x1200. This was fairly easy with the range of cards we tested here. These settings are amazing and very enjoyable. While more is better in this game, no current computer will give you everything at high res. Only the best multi-GPU solution and a great CPU are going to give you settings like the ones we have at high resolutions, but who cares about grass distance, right?
While very graphically intensive, and first person, this isn't a twitch shooter. Our experience leads us to conclude that 20fps gives a good experience. It's playable a little lower, but watch out for some jerkiness that may pop up. Getting down to 16fps and below is a little too low to be acceptable. The main point to bring home is that you really want as much eye candy as possible. While Oblivion is an immersive and awesome game from a gameplay standpoint, the graphics certainly help draw the gamer in.
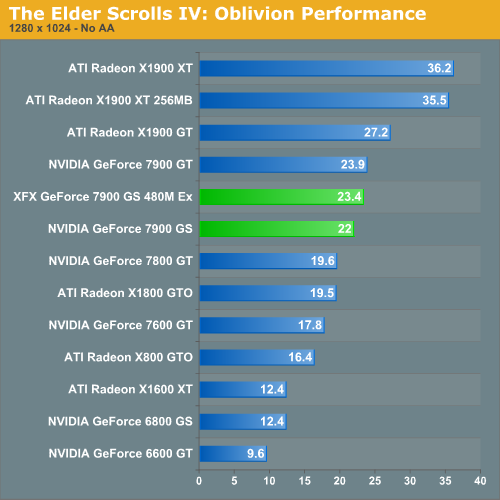
ATI's X1900 GT outperforms NVIDIA's latest midrange offering under Oblivion with our midrange detail settings. In general, ATI's architecture performs better under Oblivion than NVIDIA's, though much of the choppiness has gone away with newer drivers and the game's 1.1 patch. While framerates of under 20 can remain playable for Oblivion on the PC, the extra headroom of the X1900 GT might just allow for the all important increase in Actor and Object distances. If Oblivion performance is highly important, then the 7900 GS (in either stock or overclocked form) falls short of the competition.
The 7900 GS does perform better than the X1800 GTO, which is at least something. An X1800 XL or XT would certainly outperform the 7900 GS though.
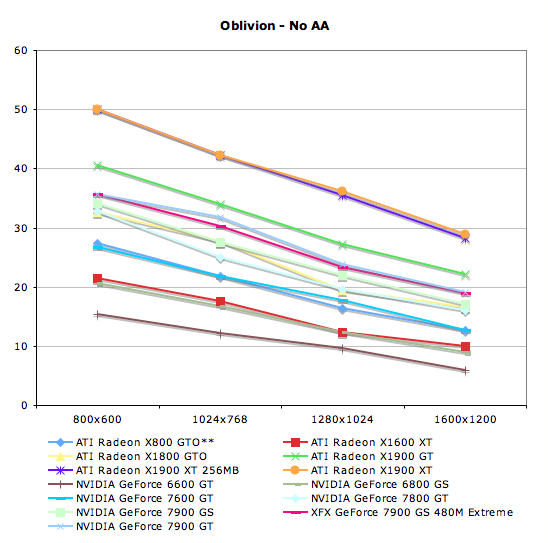
**The X800 GTO does not support SM3.0, and thus was run without HDR enabled.
| The Elder Scrolls IV: Oblivion - No AA | ||||
800x600 |
1024x768 |
1280x1024 |
1600x1200 |
|
| ATI Radeon X800 GTO | 27.4 |
21.8 |
16.4 |
12.6 |
| ATI Radeon X1600 XT | 21.5 |
17.6 |
12.4 |
9.9 |
| ATI Radeon X1800 GTO | 32.7 |
27.7 |
19.5 |
16.6 |
| ATI Radeon X1900 GT | 40.5 |
34 |
27.2 |
22.2 |
| ATI Radeon X1900 XT 256MB | 50 |
42.3 |
35.5 |
28.2 |
| ATI Radeon X1900 XT | 50 |
42.3 |
36.2 |
28.9 |
| NVIDIA GeForce 6600 GT | 15.4 |
12.1 |
9.6 |
5.9 |
| NVIDIA GeForce 6800 GS | 20.6 |
16.7 |
12.4 |
8.9 |
| NVIDIA GeForce 7600 GT | 26.7 |
21.8 |
17.8 |
12.7 |
| NVIDIA GeForce 7800 GT | 32.8 |
25 |
19.6 |
16 |
| NVIDIA GeForce 7900 GS | 34.2 |
27.5 |
22 |
17.1 |
| XFX GeForce 7900 GS 480M Extreme | 35.6 |
30.3 |
23.4 |
19 |
| NVIDIA GeForce 7900 GT | 35.6 |
31.7 |
23.9 |
19.1 |


29 Comments
View All Comments
munky - Wednesday, September 6, 2006 - link
FEAR is a DX9 game, not OpenGL...
DerekWilson - Wednesday, September 6, 2006 - link
I'm looking into this at the moment but having trouble finding documentation on it.I suppose, as I was recently testing quad sli and saw huge performance increases, I assumed the game must be using the 4 frame afr mode only possible in opengl (dx is limited to rendering 3 frames ahead). I'll keep looking for confirmation on this ...
MemberSince97 - Wednesday, September 6, 2006 - link
Jupiter EX is a DX9 rendering engine...DerekWilson - Wednesday, September 6, 2006 - link
corrected, thanks ... now I have to figure out why FEAR likes quad sli so much ...MemberSince97 - Wednesday, September 6, 2006 - link
Nice writeup DW, I really like the mouseover performance % graphs...PrinceGaz - Thursday, September 7, 2006 - link
So do I, but there is one errorThat should be 14% and 25% advantages
The 7900GS has 20 PS while the 7900GT has 24 PS. That makes the 7900GS 20% slower than the 7900GT, but it makes the 7900GT 25% faster than the 7900GS. It's important to remember which one you're comparing it against when quoting percentages.
Hopefully the percentage performance difference in the graph itself was calculated correctly, or at least consistently.
PrinceGaz - Thursday, September 7, 2006 - link
Ooops sorry, please ignore my post. For some reason I thought for a moment the 7900GS had 16 PS and the 7900GT had 20 PS (despite writing the correct values in my comment). The article is correct, I was just getting confused.PS. an edit function would be nice.
Frackal - Wednesday, September 6, 2006 - link
There is no way an X1900xt gets 75fps at 1600x1200 4xAA, at that same resolution and AA setting I get well over 120-130fps average with an X1900xtx. Most sites show it hitting at least 100+DerekWilson - Wednesday, September 6, 2006 - link
if you use the built in demo features to run a timedemo with dice's own calculations you will get a very wrong (skewed upward) number. Dice themselves say that results over 100 fps aren't reliable.the problem is that they benchmark the load screen, and generally one card or the other will get better load screen performance -- for instance, the x1900 gt may get 300+fps while the 7900 gt may only get 200fps. (I just picked those numbers, but framerates for the load screen are well over 100 fps in most cases and drastically different between manufacturers).
not only does no one care about this difference on a load screen, but it significantly interferes with benchmark numbers.
the timedemo feature can be used to output a file with frametimes and instantaneous frames per second. we have a script that opens this file, removes the frame data for the load screen, and calculates a more accurate framerate average using only frame data for scenes rendered during the benchmark run.
this will decrease over all scores.
we also benchmark in operation clean sweep which has a lot of fog and water. we use a benchmark with lots of smoke and explosions and we test for some ammount of time in or near most vehicles.
splines - Wednesday, September 6, 2006 - link
Ownage approved.