Fall '06 NVIDIA GPU Refresh - Part I: GeForce 7900 GS
by Derek Wilson on September 6, 2006 9:00 AM EST- Posted in
- GPUs
GeForce 7900 Battle: GT vs. GS
With equivalent stock clock speeds and potential 14% and 20% advantages in vertex and pixel processing respectively, we have the opportunity to better understand how G71 scales with parallelism. The following graphs are percent increases in performance from the 7900 GS to the 7900 GT for teach game at each resolution tested.
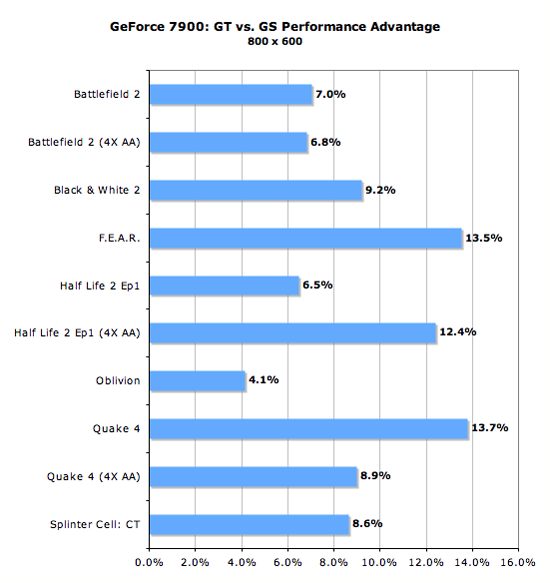
800 x 600 1024 x 768 1280x1024 1600x1200 1920x1440
The 7900 GT shows at most a 15% performance improvement over the 7900 GS in our testing. The largest performance improvement is under Oblivion at a relatively low resolution. Most of the biggest improvements seem to appear at 1024x768. As we increase resolutions, we become more bandwidth limited, and with both cards offering the same amount and speed of memory the scores begin to tighten up. Interestingly, Half-Life 2 shows zero performance difference between the GS and GT at higher resolutions. These cards are by no means CPU bound under such conditions, so we seem to have run into a bandwidth bottleneck.


29 Comments
View All Comments
munky - Wednesday, September 6, 2006 - link
FEAR is a DX9 game, not OpenGL...
DerekWilson - Wednesday, September 6, 2006 - link
I'm looking into this at the moment but having trouble finding documentation on it.I suppose, as I was recently testing quad sli and saw huge performance increases, I assumed the game must be using the 4 frame afr mode only possible in opengl (dx is limited to rendering 3 frames ahead). I'll keep looking for confirmation on this ...
MemberSince97 - Wednesday, September 6, 2006 - link
Jupiter EX is a DX9 rendering engine...DerekWilson - Wednesday, September 6, 2006 - link
corrected, thanks ... now I have to figure out why FEAR likes quad sli so much ...MemberSince97 - Wednesday, September 6, 2006 - link
Nice writeup DW, I really like the mouseover performance % graphs...PrinceGaz - Thursday, September 7, 2006 - link
So do I, but there is one errorThat should be 14% and 25% advantages
The 7900GS has 20 PS while the 7900GT has 24 PS. That makes the 7900GS 20% slower than the 7900GT, but it makes the 7900GT 25% faster than the 7900GS. It's important to remember which one you're comparing it against when quoting percentages.
Hopefully the percentage performance difference in the graph itself was calculated correctly, or at least consistently.
PrinceGaz - Thursday, September 7, 2006 - link
Ooops sorry, please ignore my post. For some reason I thought for a moment the 7900GS had 16 PS and the 7900GT had 20 PS (despite writing the correct values in my comment). The article is correct, I was just getting confused.PS. an edit function would be nice.
Frackal - Wednesday, September 6, 2006 - link
There is no way an X1900xt gets 75fps at 1600x1200 4xAA, at that same resolution and AA setting I get well over 120-130fps average with an X1900xtx. Most sites show it hitting at least 100+DerekWilson - Wednesday, September 6, 2006 - link
if you use the built in demo features to run a timedemo with dice's own calculations you will get a very wrong (skewed upward) number. Dice themselves say that results over 100 fps aren't reliable.the problem is that they benchmark the load screen, and generally one card or the other will get better load screen performance -- for instance, the x1900 gt may get 300+fps while the 7900 gt may only get 200fps. (I just picked those numbers, but framerates for the load screen are well over 100 fps in most cases and drastically different between manufacturers).
not only does no one care about this difference on a load screen, but it significantly interferes with benchmark numbers.
the timedemo feature can be used to output a file with frametimes and instantaneous frames per second. we have a script that opens this file, removes the frame data for the load screen, and calculates a more accurate framerate average using only frame data for scenes rendered during the benchmark run.
this will decrease over all scores.
we also benchmark in operation clean sweep which has a lot of fog and water. we use a benchmark with lots of smoke and explosions and we test for some ammount of time in or near most vehicles.
splines - Wednesday, September 6, 2006 - link
Ownage approved.