Seagate Barracuda 7200.10 750GB: Size Does Matter
by Gary Key on May 18, 2006 9:00 AM EST- Posted in
- Storage
IPEAK Game Installation Tests
Our IPEAK based Game Installation benchmarks simply show the ability of the hard drive to write data as quickly as possible to the disk based upon the installation software instructions. As detailed in our IPEAK setup description, we installed the games from our source drive in order to eliminate the optical drive bottleneck. In separate application timing we witnessed basically the same percentage spread when installing the games via our DVD drive so these results are representative of actual installation performance.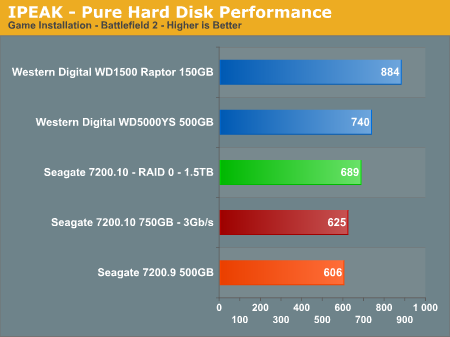
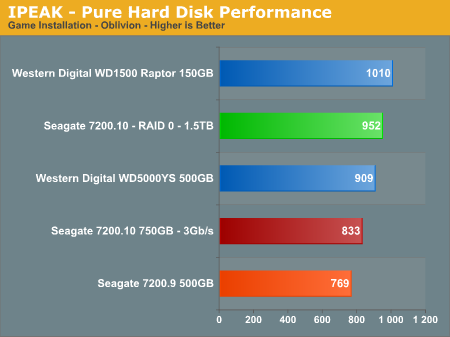
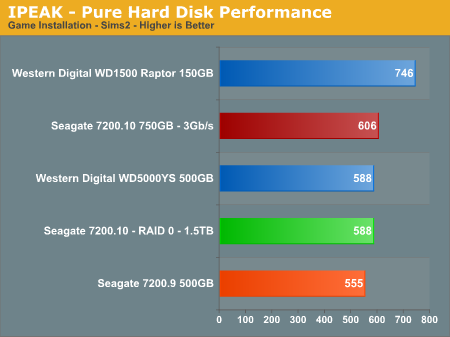
We see both WD drives performing very well in these benchmarks, with the speed of the WD Raptor along with its impressive and sustainable transfer rates simply dominating the other drives in these tests. The write performance of the Seagate 7200.10 is very good in the Sims 2 benchmark as the disk utilization numbers are very consistent along with a close grouping of block sizes. The drive seems to thrive on consistent read/write requests for medium to large size blocks of information with seek distances that are close to zero.
The performance of the Seagate 7200.10 trails off in the Oblivion and Battlefield 2 benchmarks as the disk utilization numbers begin to vary along with seek distances that are no longer clustered together. Considering the platter density used in this drive, if the requests do not involve data residing on the same track, then the cache buffer will probably not be able to satisfy the request resulting in a bottleneck effect due to track-to-track seeks or poor rotational latencies. The effects of RAID 0 in these tests are minimal with performance actually suffering during our Sims 2 load test, which is a more representative result with RAID 0 in actual application usage.
IPEAK Game Play Tests
The IPEAK based Game Play tests are centered on the benefits of having a hard disk that can load non-linear and/or sequential data files quickly without interrupting the flow of the game. While the benchmark numbers indicate the performance ability of the drives within the game, these numbers will not correlate into an increase in frame rates, only an improvement in level load times, game initiation, and general responsiveness of the storage system.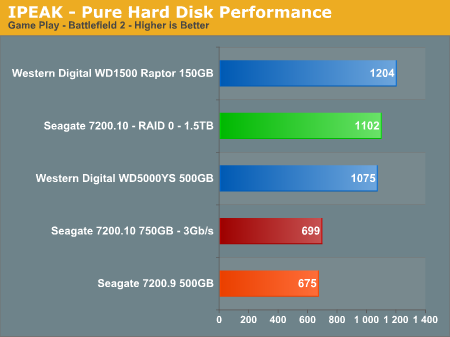

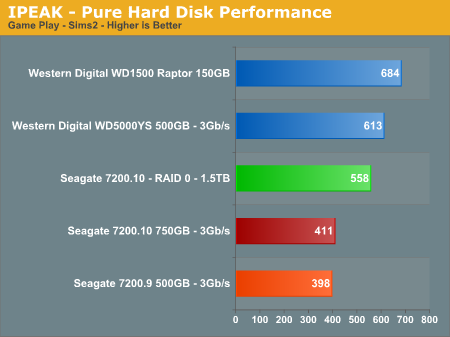
The Seagate drives struggle in these benchmarks compared to the Western Digital offerings. However, we did not notice any slowdowns or stuttering during actual game play or playback of our trace recordings to analyze the drive's performance. The Seagate 7200.10 outperforms the 7200.9 by 3% in Sims 2, 5% in Oblivion, and 4% in Battlefield 2. The RAID 0 performance in Battlefield 2 was impressive from an I/O perspective while during actual game testing the load time was improved by 7%. The RAID 0 performance in our other two games showed the typical increase in I/O performance but in actual game play it was not noticeable. The WD Raptor continues it dominance against other drives in the gaming benchmarks but the WD RE2 500GB makes a strong case as high capacity gaming drive.
After an analysis of our trace files we recognized a familiar pattern with the Seagate 7200.10 as the seek distances were not clustered together resulting in the inability of the drive to keep the requests cached resulting in a bottleneck effect during track to track seeks and the resulting rotational latency. This issue compounds itself on drives with multiple high density platters. Until we are able to review the smaller capacity drives in the 7200.10 series it will be difficult to determine if the drive requires additional firmware tuning for increasingly complex localized data access patterns, improved caching algorithms, or an increase in cache size to compensate for the 41% increase in platter density.


44 Comments
View All Comments
segagenesis - Thursday, May 18, 2006 - link
... for when we see 1TB in a single drive. Despite the cost the sheer amount of storage available in a single drive is amazing.One thing I have to question though, maybe I missed it in the article, how much space do you "lose" when you format a 750GB drive? Yes I am aware of the 1000 vs. 1024 bits per byte differences... but how bad is it getting now?
Gary Key - Thursday, May 18, 2006 - link
The capacity differences from the drive manufacturers and what the operating system reports are on page 5. In this case, Seagate claims 750GB, current operating systems will report and provide 698.6GB of storage capacity. :)
mino - Thursday, May 18, 2006 - link
Actually no, there is no "capacity difference".750GB as SI-System Giga-Bytes means 750*10^9 B = 750.000.000.000 bytes = 0.75TB
this will an OS call 750 000 000 000 bytes(B) = 732.421.875 kB = 715.255 MB = 698 GB = 0.682 TB
The amount of data is the same, those are just different units.
Gary Key - Thursday, May 18, 2006 - link
We know this, that is why we do not refer to the drives "formated capacity" as if the drive lost data capacity because you formatted it. He had already mentioned he knew the calculation difference so I was simply answering his question on how the OS would report the data "capacity" (probably the wrong word to use) compared to Seagate in this case. If the drive industry adhered to the standard everyone else is utilizing then life in this case would be simple. ;-)