ATI's New Leader in Graphics Performance: The Radeon X1900 Series
by Derek Wilson & Josh Venning on January 24, 2006 12:00 PM EST- Posted in
- GPUs
Image Quality, Feature Tests, and Power
Something we'd like to look at a bit more in-depth for this review is image quality. It's no secret that due to ATI and NVIDIA's differences in rendering graphics, there is always going to be some variation in the look of the graphics from one brand to another. Most times this variation is too subtle to notice, but upon closer inspection, certain patterns tend to emerge.
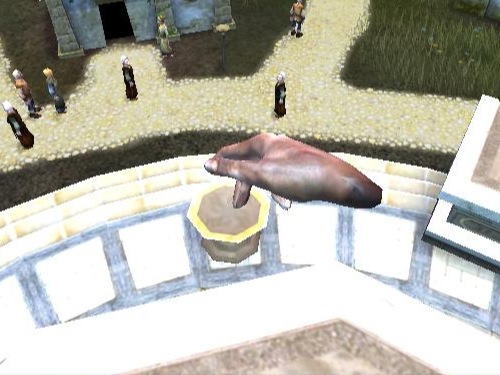
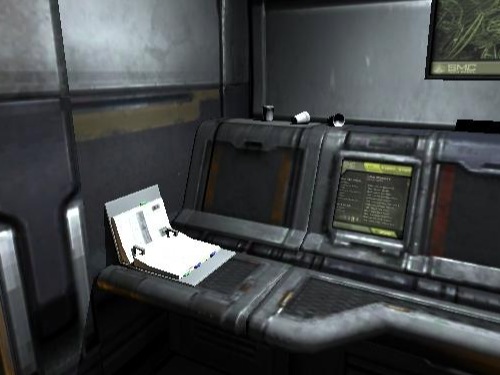
With Black and White 2, we can see how well the in-game maximum AA does at cleaning up the image. Note how there is a significant difference between the edges in the pictures without AA and with "high" AA enabled by the game. However, we don't see the same kind of difference between the image without AA enabled and the one with maximum quality enabled (in the graphics driver). This is a good example of in-game AA doing a much better job, quality and performance-wise, than the max quality settings in the control panel. We suspect that Black and White 2 has implimented a custom AA algorithm and has issues running stock MSAA algorithms. For this reason we recommend using the Black and White 2's in-game AA instead of the control panel's AA settings.
Both ATI and NVIDIA hardware look great and render similar images, and luckily for ATI there is an upcoming patch that should improve performance.
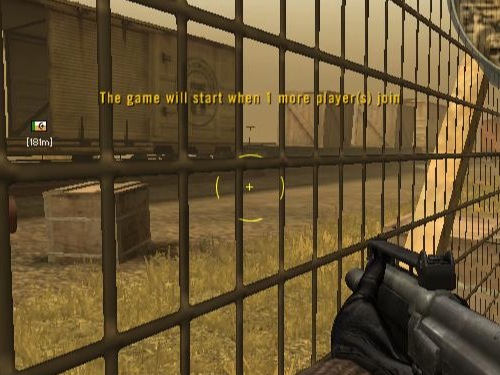
Battlefield 2 gives us a good view of how the maximum quality settings in the control panel (specifically transparency AA) fix certain graphical problems in games. Fences in particular have a tendency to render inaccurately, especially when looking through them at certain angles. While you can see that the in-game AA without adaptive or transparency AA cleans up a lot of jagged edges (the flag pole for instance), it still has trouble with parts of the fence.
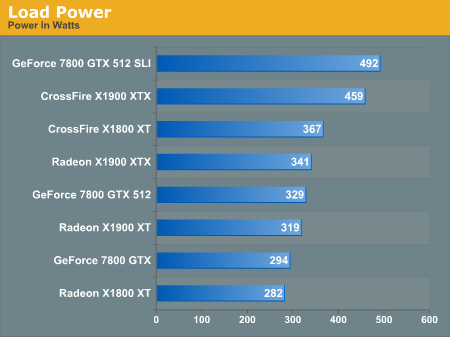
As for power, we ran the multitexturing and pixel shader feature tests under 3dmark06 and measured the maximum powerload via our trusty Kill-A-Watt. This measures power at the wall before the PSU, so it doesn't focus only on the graphics cards.
We can see the CrossFire and SLI systems pull insane ammounts of power, but even as a single card the X1900 XTX is a very hungry part.
Something we'd like to look at a bit more in-depth for this review is image quality. It's no secret that due to ATI and NVIDIA's differences in rendering graphics, there is always going to be some variation in the look of the graphics from one brand to another. Most times this variation is too subtle to notice, but upon closer inspection, certain patterns tend to emerge.
Hold your mouse over the links below to see Image Quality (Right Click the links to download the full-resolution images):
| ATI | |||
| NVIDIA |
With Black and White 2, we can see how well the in-game maximum AA does at cleaning up the image. Note how there is a significant difference between the edges in the pictures without AA and with "high" AA enabled by the game. However, we don't see the same kind of difference between the image without AA enabled and the one with maximum quality enabled (in the graphics driver). This is a good example of in-game AA doing a much better job, quality and performance-wise, than the max quality settings in the control panel. We suspect that Black and White 2 has implimented a custom AA algorithm and has issues running stock MSAA algorithms. For this reason we recommend using the Black and White 2's in-game AA instead of the control panel's AA settings.
Both ATI and NVIDIA hardware look great and render similar images, and luckily for ATI there is an upcoming patch that should improve performance.
Hold your mouse over the links below to see Image Quality (Right Click the links to download the full-resolution images):
Hold your mouse over the links below to see Image Quality (Right Click the links to download the full-resolution images):
Battlefield 2 gives us a good view of how the maximum quality settings in the control panel (specifically transparency AA) fix certain graphical problems in games. Fences in particular have a tendency to render inaccurately, especially when looking through them at certain angles. While you can see that the in-game AA without adaptive or transparency AA cleans up a lot of jagged edges (the flag pole for instance), it still has trouble with parts of the fence.
As for power, we ran the multitexturing and pixel shader feature tests under 3dmark06 and measured the maximum powerload via our trusty Kill-A-Watt. This measures power at the wall before the PSU, so it doesn't focus only on the graphics cards.
We can see the CrossFire and SLI systems pull insane ammounts of power, but even as a single card the X1900 XTX is a very hungry part.


120 Comments
View All Comments
Live - Tuesday, January 24, 2006 - link
Thanks for the explanation! Derek I think this merits a mention in the review.NullSubroutine - Tuesday, January 24, 2006 - link
perhaps a flash system where you can pick the card within the benchmark and it will show it on the line graph. just simply activate/deactivate feature.bldckstark - Tuesday, January 24, 2006 - link
I have to agree that a group color for the multi-GPU setups would be helpful on the bar graphs. The outline you used to denote negative gains would work well for this. Then ATI and Nvidia bars would still have a different major color, but the multi-GPU setups could have a yellow outline. E.G. ATI = red, ATI X-fire = Red w/ yellow outline, Nvidia = blue, Nvidia SLI = blue w/ yellow outline.Rock Hydra - Tuesday, January 24, 2006 - link
I don't know if you meant this or not, on the page mentioning the new crossfire board. There is url, I don't know if it was intended to be active or plain text, but I thought I would just bring that to your attention.DerekWilson - Tuesday, January 24, 2006 - link
thanks, fixedemilyek - Tuesday, January 24, 2006 - link
Good article.You have two typos in your article.
In the system specs you have OZC Powerstreams instead of ...stream
When you use the words 'eek out' as a verb that means 'squeeze out', it is spelled 'eke'-- 'eke out'.
DerekWilson - Tuesday, January 24, 2006 - link
I had no idea there was a correct spelling for eke ...thanks
beggerking - Tuesday, January 24, 2006 - link
Did anyone notice it? the breakdown graphs doesn't quite reflect the actual data..the breakdown is showing 1900xtx being much faster than 7800 512, but in the actual performance graph 1900xtx is sometimes outpaced by 7800 512..
DerekWilson - Tuesday, January 24, 2006 - link
We didn't aggregate performance of each card under each game.for the percent improvment breakdown we only looked at 2048x1536 with 4xAA which clearly shows the x1900xtx in the lead.
our reasoning is that this is the most stressful stock test we throw at the cards -- it shows what the cards can handle under the highest stress.
beggerking - Tuesday, January 24, 2006 - link
umm.. what about 8xAA or higher? or lower resolution? w/wo AA?if you don't aggregate performance, then won't the graphic be misleading?
isn't max quality the most stressful test ?