Futuremark's Latest Attempt: 3DMark06 Tested
by Josh Venning on January 18, 2006 11:00 AM EST- Posted in
- GPUs
Performance Tests
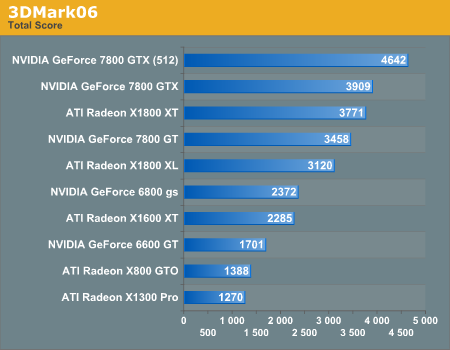
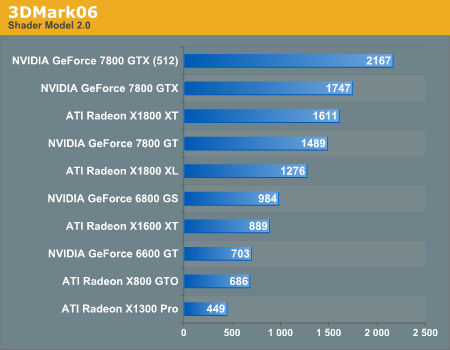
We ran several tests with the latest version of 3DMark to see what kind of results we would get across a range of NVIDIA and ATI cards. There are a number of different tests that 3DMark can perform to stress different aspects of the system, but the three tests that we will be focusing on here are Shader Model 2.0 graphics, HDR/Shader Model 3.0 graphics, and the overall score. Here is what we tested:
NVIDIA 6600 GT
NVIDIA 6800 GS
NVIDIA 7800 GT
NVIDIA 7800 GTX
NVIDIA 7800 GTX 512
ATI X800 GTO
ATI X1300 Pro
ATI X1600 XT
ATI X1800 XL
ATI X1800 XT
MSI K8N Neo4 Platinum/SLI motherboard
AMD Athlon 64 FX-55 Processor
2x512MB OCZ 2-2-2-6 1T DDR400 RAM
Seagate 7200.7 120 GB Hard Drive
OCZ 600 W PowerStream Power Supply
The 3DMark06 benchmark is very straightforward. There are different settings that can be changed such as resolution and Anti-Aliasing, and clicking "Run 3DMark" will run the demos back-to-back and display the results when finished. For these tests, we chose the default resolution of 1280X1024 (no AA or AF).
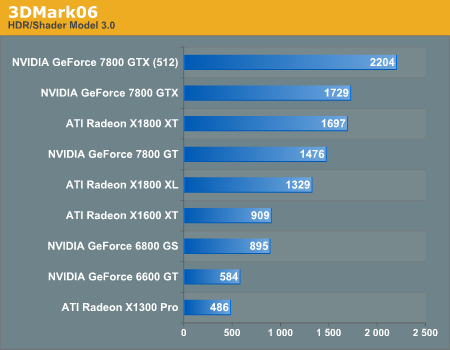
(Note that in the HDR/SM3.0 graph, the X800 GTO is not included as it is incapable of rendering these effects.)
We can see by the graphs that 3DMark's graphics tests favor NVIDIA hardware over ATI, which is a further illustration of why 3DMark isn't really the best program for performance testing between cards. We know that different games tend to do better or worse on different hardware depending on the way the game was made, so a tool like 3DMark won't necessarily determine which card would be best suited for a specific game. This is an important fact for users in the market for a new card to realize before they spend their hard-earned money.
3DMark06 is a very stressful benchmark and as could be expected, some of the less powerful cards ran the demos very slowly. Because the graphics are so intensive, the effects were quite stunning, especially on the high end cards like the 7800 GTX (512) and the X1800 XT. During the firefly scenes, the warm glow of the fireflies in the night created intricate, hypnotic reflections of the foliage, and the brilliant white of the snow and sun in the arctic outpost demo at the end were striking. But at the end of our testing, we are mostly left with shallow beauty rather than a deep, meaningful connection. The overall 3DMark scores don't really give us much more information than we already have; other than simply letting us know what hardware runs 3DMark better.
We ran several tests with the latest version of 3DMark to see what kind of results we would get across a range of NVIDIA and ATI cards. There are a number of different tests that 3DMark can perform to stress different aspects of the system, but the three tests that we will be focusing on here are Shader Model 2.0 graphics, HDR/Shader Model 3.0 graphics, and the overall score. Here is what we tested:
NVIDIA 6600 GT
NVIDIA 6800 GS
NVIDIA 7800 GT
NVIDIA 7800 GTX
NVIDIA 7800 GTX 512
ATI X800 GTO
ATI X1300 Pro
ATI X1600 XT
ATI X1800 XL
ATI X1800 XT
MSI K8N Neo4 Platinum/SLI motherboard
AMD Athlon 64 FX-55 Processor
2x512MB OCZ 2-2-2-6 1T DDR400 RAM
Seagate 7200.7 120 GB Hard Drive
OCZ 600 W PowerStream Power Supply
The 3DMark06 benchmark is very straightforward. There are different settings that can be changed such as resolution and Anti-Aliasing, and clicking "Run 3DMark" will run the demos back-to-back and display the results when finished. For these tests, we chose the default resolution of 1280X1024 (no AA or AF).
(Note that in the HDR/SM3.0 graph, the X800 GTO is not included as it is incapable of rendering these effects.)
We can see by the graphs that 3DMark's graphics tests favor NVIDIA hardware over ATI, which is a further illustration of why 3DMark isn't really the best program for performance testing between cards. We know that different games tend to do better or worse on different hardware depending on the way the game was made, so a tool like 3DMark won't necessarily determine which card would be best suited for a specific game. This is an important fact for users in the market for a new card to realize before they spend their hard-earned money.
3DMark06 is a very stressful benchmark and as could be expected, some of the less powerful cards ran the demos very slowly. Because the graphics are so intensive, the effects were quite stunning, especially on the high end cards like the 7800 GTX (512) and the X1800 XT. During the firefly scenes, the warm glow of the fireflies in the night created intricate, hypnotic reflections of the foliage, and the brilliant white of the snow and sun in the arctic outpost demo at the end were striking. But at the end of our testing, we are mostly left with shallow beauty rather than a deep, meaningful connection. The overall 3DMark scores don't really give us much more information than we already have; other than simply letting us know what hardware runs 3DMark better.


45 Comments
View All Comments
MrKaz - Wednesday, January 18, 2006 - link
That means that R580 will boom GTX512 like X1800XT gets boomed by it now.4 X1600 cores (R580) will give some 6855 total score, not bad…
defter - Saturday, January 21, 2006 - link
"That means that R580 will boom GTX512 like X1800XT gets boomed by it now."Here are some X1900XT benchmarks: http://www.overclockers.ru/images/news/2006/01/21/...">http://www.overclockers.ru/images/news/2006/01/21/...
They used a faster CPU, but if we ignore the CPU tests results should be comparable with Anand's results:
PS2.0 score:
X1900XT (625/1450) with FX-60: 2081
7800GTX 512 with FX-55: 2167
X1800XT with FX-55: 1611
PS3.0 score:
X1900XT (625/1450) with FX-60: 2279
7800GTX 512 with FX-55: 2204
X1800XT with FX-55: 1697
X1900XT seems to be a little slower than 7800GTX 512 while X1900XTX should be a little faster. In any case the difference is only 2-3%.
defter - Thursday, January 19, 2006 - link
"4 X1600 cores (R580) will give some 6855 total score, not bad"Will R580 have 4x memory bandwidth? X1600XT has 22GB/s of memory bandwidth.
I wouldn't call X1600XT scores very impressive. X1600XT is running at 590MHz core/590MHz memory and with 12 pipelines is 34% faster than 500MHz core/500MHz memory 8 pipeline 6600 GT (which is 1.5 years old chip).
Boushh - Tuesday, June 19, 2012 - link
I came across this old 3DMark06 and thought: why not test it with my current setup and see how it does against the fastest cards of early 2006 ?The result is actualy shocking:
Total: 14301
SM2.0: 6180
SM3.0: 7886
CPU: 2780
It's not that I have any kind of super game machine. It's just a WindowsXP machine with an Intel E-7600 and a Nvidia 560 Ti. Not overclocked or anything.
That is roughly tripple the score. And not even tested on an high-end system B-)
Thanks for letting my add a comment to this old post Anandtech, many sites do not allow that.
If any one else reads this, please take the time to test your setup as well. If not, I may be back in a few years and test again :-)
Boushh - Tuesday, August 11, 2015 - link
And I'm back again !!Now the test was done with the same system, but with a GeForce GTX760. Oddly enough, the scores are lower ?
Total: 12295
SM2.0: 5342
SM3.0: 6031
CPU: 2785
I had at least expected double the score or something like that B-(
l, let's see how it goes when I have a new card....