nForce4 SLI Motherboards: Premium Performance at a Bargain Price
by Gary Key on January 3, 2006 12:05 AM EST- Posted in
- Motherboards
Disk Controller Performance
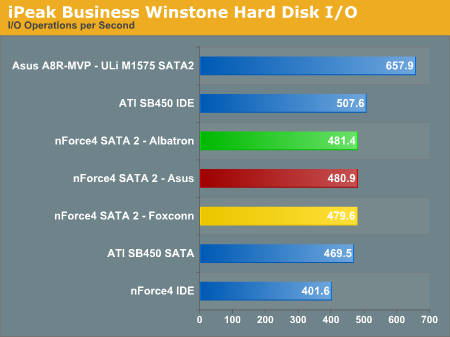
With the variety of disk drive benchmarks available, we needed a means of comparing the true performance of the wide selection of controllers. The logical choice was Anand's storage benchmark first described in Q2 2004 Desktop Hard Drive Comparison: WD Raptor vs. the World. To refresh your memory, the iPeak test was designed to measure "pure" hard disk performance, and in this case, we kept the hard drive as consistent as possible while varying the hard drive controller. The idea is to measure the performance of a hard drive controller with a consistent hard drive.
We played back Anand's raw files that recorded I/O operations when running a real world benchmark - the entire Winstone 2004 suite. Intel's iPEAK utility was then used to play back the trace file of all IO operations that took place during a single run of Business Winstone 2004 and MCC Winstone 2004. To try to isolate performance difference to the controllers that we were testing, we used the Seagate 120GB 7200 RPM SATA (8MB Buffer) in all tests. The drive was formatted before each test run and a composite average of 5 tests on each controller interface was tabulated in order to ensure consistency in the benchmark.
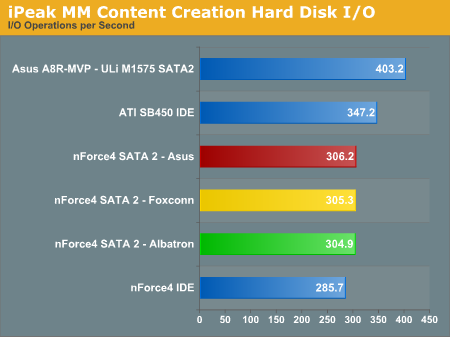
iPeak gives a mean service time in milliseconds; in other words, the average time that each drive took to fulfill each IO operation. In order to make the data more understandable, we report the scores as an average number of IO operations per second so that higher scores translate into better performance. This number is meaningless as far as hard disk performance is concerned as it is just the number of IO operations completed in a second. However, the scores are useful for comparing "pure" performance of the storage controllers in this case.
It is impressive that the ATI SB450 IDE performance tops the NVIDIA nForce4 SATA 2 performance in both benchmarks.
Firewire and USB Performance
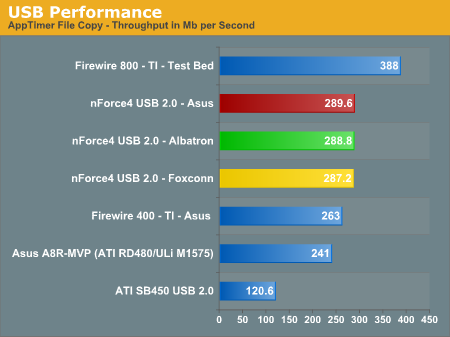
After looking at many options for Firewire and USB testing, we finally determined that an external USB 2.0, Firewire 400, and Firewire 800 hard disk might be a sensible way to look at USB and Firewire throughput.
Our first efforts at testing with an IDE or SATA drive as the "server" yielded very inconsistent results, since Windows XP sets up cache schemes to improve performance. Finally, we decided to try a RAM disk as our "server", since memory removed almost all overhead from the serving end. We also managed to turn off disk caching on the USB and Firewire side by setting up the drives for "quick disconnect" and our results were then consistent over many test runs.
We used 1GB of fast 2-2-2-5 system memory set up as a 450MB RAM disk and 550MB of system memory. Our standard file is the SPECviewPerf install file, which is 432,533,504 bytes (412.4961MB). After copying this file to our RAM disk, we measured the time for writing from the RAM disk to our external USB 2.0, Firewire 400, or Firewire 800 drive using a Windows timing program written for AnandTech by our own Jason Clark. The copy times in seconds were then converted into Megabits per second (Mb) to provide a convenient means of comparing throughput. Higher Rates therefore mean better performance in this particular test.
With the variety of disk drive benchmarks available, we needed a means of comparing the true performance of the wide selection of controllers. The logical choice was Anand's storage benchmark first described in Q2 2004 Desktop Hard Drive Comparison: WD Raptor vs. the World. To refresh your memory, the iPeak test was designed to measure "pure" hard disk performance, and in this case, we kept the hard drive as consistent as possible while varying the hard drive controller. The idea is to measure the performance of a hard drive controller with a consistent hard drive.
We played back Anand's raw files that recorded I/O operations when running a real world benchmark - the entire Winstone 2004 suite. Intel's iPEAK utility was then used to play back the trace file of all IO operations that took place during a single run of Business Winstone 2004 and MCC Winstone 2004. To try to isolate performance difference to the controllers that we were testing, we used the Seagate 120GB 7200 RPM SATA (8MB Buffer) in all tests. The drive was formatted before each test run and a composite average of 5 tests on each controller interface was tabulated in order to ensure consistency in the benchmark.
iPeak gives a mean service time in milliseconds; in other words, the average time that each drive took to fulfill each IO operation. In order to make the data more understandable, we report the scores as an average number of IO operations per second so that higher scores translate into better performance. This number is meaningless as far as hard disk performance is concerned as it is just the number of IO operations completed in a second. However, the scores are useful for comparing "pure" performance of the storage controllers in this case.
It is impressive that the ATI SB450 IDE performance tops the NVIDIA nForce4 SATA 2 performance in both benchmarks.
Firewire and USB Performance
After looking at many options for Firewire and USB testing, we finally determined that an external USB 2.0, Firewire 400, and Firewire 800 hard disk might be a sensible way to look at USB and Firewire throughput.
Our first efforts at testing with an IDE or SATA drive as the "server" yielded very inconsistent results, since Windows XP sets up cache schemes to improve performance. Finally, we decided to try a RAM disk as our "server", since memory removed almost all overhead from the serving end. We also managed to turn off disk caching on the USB and Firewire side by setting up the drives for "quick disconnect" and our results were then consistent over many test runs.
We used 1GB of fast 2-2-2-5 system memory set up as a 450MB RAM disk and 550MB of system memory. Our standard file is the SPECviewPerf install file, which is 432,533,504 bytes (412.4961MB). After copying this file to our RAM disk, we measured the time for writing from the RAM disk to our external USB 2.0, Firewire 400, or Firewire 800 drive using a Windows timing program written for AnandTech by our own Jason Clark. The copy times in seconds were then converted into Megabits per second (Mb) to provide a convenient means of comparing throughput. Higher Rates therefore mean better performance in this particular test.


37 Comments
View All Comments
Gary Key - Wednesday, January 4, 2006 - link
As stated in the article the current pricing structure lends itself to the purchase of an SLI capable motherboard if the nForce4 is your chipset of choice. Even if you do not utilize SLI you at least have the option of doing so, if not for gaming, then for multiple monitor support and excellent performance utilizing two x8 lanes. If you look at the current support from the motherboard suppliers and product plans it is very obvious that SLI/CrossFire capable motherboards are becoming the standard across all price points. Our statements were based on these facts regarding the motherboard choices available. If you consider the potential cost/performance benefits then why pay the same amount of money for a board that is not capable of SLI or CrossFire and will probably not receive the same level of support over the lifespan of the product.
bob661 - Wednesday, January 4, 2006 - link
Isn't this a contradiction?
Capt Caveman - Tuesday, January 3, 2006 - link
What are you talking about? You can get a SLI board for $70.andlcool - Tuesday, January 3, 2006 - link
for the asus one, it should be ddr and not ddr2.ElFenix - Tuesday, January 3, 2006 - link
still, should be a good price for stock speed boardsElFenix - Tuesday, January 3, 2006 - link
looking at the first chart i mean. doesn't seem to fall off much eh?<--- wants an edit function
Gary Key - Tuesday, January 3, 2006 - link
The Foxconn board offered excellent stability throughout testing although it certainly is not targeted at the overclocking crowd. The performance was certainly acceptable and without the benchmarks you probably would not be able to tell the difference between it and the other boards. The layout is really nice unless you plan on utilizing two video cards with two slot cooling solutions as the space becomes very tight between the two x16 slots.I would like an edit function also. ;->