Intel's Pentium Extreme Edition 955: 65nm, 4 threads and 376M transistors
by Anand Lal Shimpi on December 30, 2005 11:36 AM EST- Posted in
- CPUs
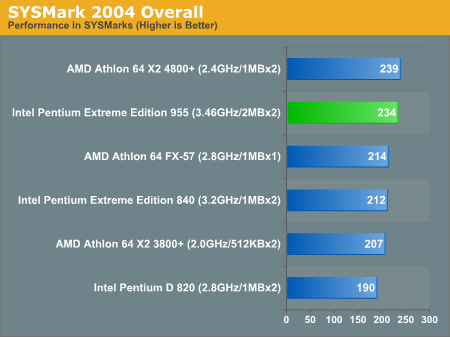
Overall Performance using SYSMark 2004
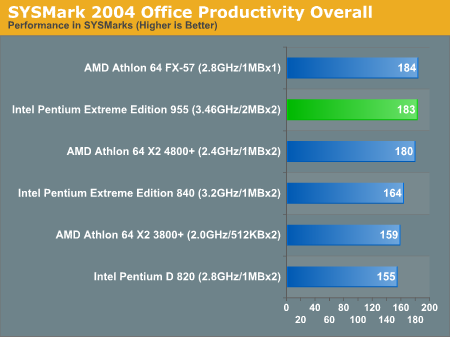
Office Productivity SYSMark 2004
SYSMark's Office Productivity suite consists of three tests, the first of which is the Communication test. The Communication test consists of the following:
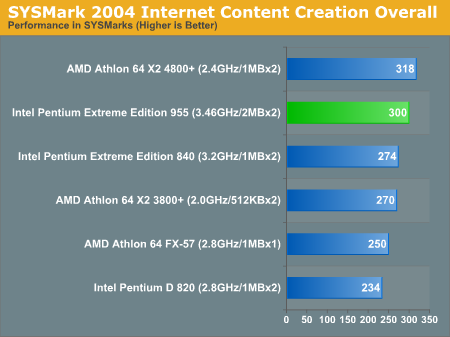
ICC SYSMark 2004
The first category that we will deal with is 3D Content Creation. The tests that make up this benchmark are described below:
Office Productivity SYSMark 2004
SYSMark's Office Productivity suite consists of three tests, the first of which is the Communication test. The Communication test consists of the following:
"The user receives an email in Outlook 2002 that contains a collection of documents in a zip file. The user reviews his email and updates his calendar while VirusScan 7.0 scans the system. The corporate web site is viewed in Internet Explorer 6.0. Finally, Internet Explorer is used to look at samples of the web pages and documents created during the scenario."The next test is Document Creation performance:
"The user edits the document using Word 2002. He transcribes an audio file into a document using Dragon NaturallySpeaking 6. Once the document has all the necessary pieces in place, the user changes it into a portable format for easy and secure distribution using Acrobat 5.0.5. The user creates a marketing presentation in PowerPoint 2002 and adds elements to a slide show template."The final test in our Office Productivity suite is Data Analysis, which BAPCo describes as:
"The user opens a database using Access 2002 and runs some queries. A collection of documents are archived using WinZip 8.1. The queries' results are imported into a spreadsheet using Excel 2002 and are used to generate graphical charts."
ICC SYSMark 2004
The first category that we will deal with is 3D Content Creation. The tests that make up this benchmark are described below:
"The user renders a 3D model to a bitmap using 3ds max 5.1, while preparing web pages in Dreamweaver MX. Then the user renders a 3D animation in a vector graphics format."Next, we have 2D Content Creation performance:
"The user uses Premiere 6.5 to create a movie from several raw input movie cuts and sound cuts and starts exporting it. While waiting on this operation, the user imports the rendered image into Photoshop 7.01, modifies it and saves the results. Once the movie is assembled, the user edits it and creates special effects using After Effects 5.5."The Internet Content Creation suite is rounded up with a Web Publishing performance test:
"The user extracts content from an archive using WinZip 8.1. Meanwhile, he uses Flash MX to open the exported 3D vector graphics file. He modifies it by including other pictures and optimizes it for faster animation. The final movie with the special effects is then compressed using Windows Media Encoder 9 series in a format that can be broadcast over broadband Internet. The web site is given the final touches in Dreamweaver MX and the system is scanned by VirusScan 7.0."


84 Comments
View All Comments
Anand Lal Shimpi - Friday, December 30, 2005 - link
I had some serious power/overclocking issues with the pre-production board Intel sent for this review. I could overclock the chip and the frequency would go up, but the performance would go down significantly - and the chip wasn't throttling. Intel has a new board on the way to me now, and I'm hoping to be able to do a quick overclocking and power consumption piece before I leave for CES next week.Take care,
Anand
Betwon - Friday, December 30, 2005 - link
We find that it isn't scientific. Anandtech is wrong.
You should give the end time of the last completed task, but not the sum of each task's time.
For expamle: task1 and task2 work at the same time
System A only spend 51s to complete the task1 and task2.
task1 -- 50s
task2 -- 51s
System B spend 61s to complete the task1 and task2.
task1 -- 20s
task2 -- 61s
It is correct: System A(51s) is faster than System B(61s)
It is wrong: System A(51s+50s=101s) is slower than System B(20s+61s=81s)
tygrus - Tuesday, January 3, 2006 - link
The problem is they don't all finish at the same time and the ambiguous work of a FPS task running.You could start them all and measure the time taken for all tasks to finish. That's a workload but it can be susceptible to the slowest task being limited by its single thread performance (once all other tasks are finished, SMP underutilised).
Another way is for tasks that take longer and run at a measurable and consistent speed.
Is it possible to:
* loop the tests with a big enough working set (that insures repeatable runs);
* Determine average speed of each sub-test (or runs per hour) while other tasks are running and being monitored;
* Specify a workload based on how many runs, MB, Frames etc. processed by each;
* Calculate the equivalent time to do a theoretical workload (be careful of the method).
Sub-tasks time/speed can be compared to when they were run by themselves (single thread, single active task). This is complicated by HyperThreading and also multi-threaded apps under test. You can work out the efficiency/scaling of running multiple tasks versus one task at a time.
You could probably rejig the process priorities to get better 'Splinter Cell' performance.
Viditor - Saturday, December 31, 2005 - link
Scoring needs to be done on a focused window...By doing multiple runs with all of the programs running simultaneously, it's possible to extract a speed value for each of the programs in turn, under those conditions. The cumulative number isn't representative of how long it actually took, but it's more of a "score" on the performance under a given set of conditions.
Betwon - Saturday, December 31, 2005 - link
NO! It is the time(spend time) ,not the speed value.You see:
24.8s + 13.7s = 38.5s
42.8s + 42.2s + 46.6s + 65.9s = 197.5s
Anandtech's way is wrong.
Viditor - Saturday, December 31, 2005 - link
It's a score value...whether it's stated in time or even an arbitrary number scale matters very little. The values are still justified...
Betwon - Saturday, December 31, 2005 - link
You don't know how to test.But you still say it correct.
We all need the explains from anandtech.
Viditor - Saturday, December 31, 2005 - link
Then I better get rid of these pesky Diplomas, eh?
I'll go tear them up right now...:)
Betwon - Saturday, December 31, 2005 - link
I mean: You don't know how the anandtech go on the tests.The way of test.
What is the data.
We only need the explain from anandtech, but not from your guess.
Because you do not know it!
you are not anandtech!
Viditor - Saturday, December 31, 2005 - link
Thank you for the clarification (does anyone have any sticky tape I could borrow? :)What we do know is:
1. All of the tests were started simultaneously..."To find out, we put together a couple of multitasking scenarios aided by a tool that Intel provided us to help all of the applications start at the exact same time"
2. The 2 ways to measure are: finding out individual times in a multitasking environment (what I think they have done), or producing a batch job (which is what I think you're asking for) and getting a completion time.
Personally, I think that the former gives us far more usefull information...
However, neither scenario is more scientifically correct than the other.