Investigations into Athlon X2 Overclocking
by Jarred Walton on December 21, 2005 12:00 PM EST- Posted in
- CPUs
Power and Heat
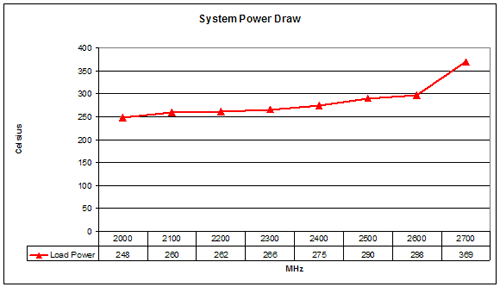
One area that we overlooked last time was the system power draw as well as the CPU temperature. We spent some additional time measuring these items with the X2. Total power draw was measured at the wall using a Kill-A-Watt device. We used a batch file to run 3DMark03, 3DMark05, PCMark04, and PCMark05 sequentially. The maximum power draw invariably came during 3DMark05, with all three game tests falling very close together. Test 1 (Return to Proxycon) and test 2 (Firefly Forest) typically registered a few Watts higher than test 3 (Canyon Flight ), though this trend may not hold with other system configurations. Also, since we were overclocking, AMD's Cool 'n Quiet feature was disabled - it tends to interfere with overclocking efforts.
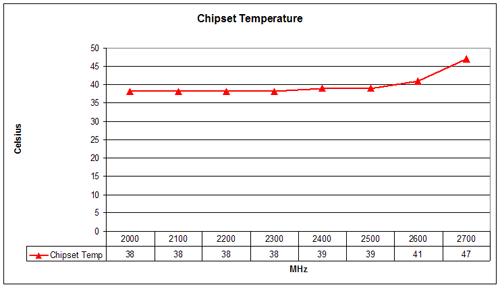
In addition to measuring the power draw, we used NVIDIA's nTune System Monitor to record temperatures of the chipset and processor. While we would be hesitant to use the results from nTune across different motherboards due to potential variance, since we are only using one motherboard, the values are measured consistently. The temperatures were measured using the same series of tests, with the 3DMark05 CPU test causing the highest recorded temperatures. (Note that the benchmark results for Futuremark products were collected in a separate run of these tests so that nTune wouldn't impact the results.)
We only recorded temperatures and power draw for one configuration, using the OCZ VX RAM - staring at a Watt meter for 20 minutes per configuration was already bad enough! Informal checks on other configurations showed that the results were consistent - additional RAM in the 2GB configurations drew a bit more power, but CPU and chipset temperatures were within 1 degree Celsius. Also, unlike the remaining benchmarks, we verified the voltage requirements, power draw, and temperatures at every setting in 100 MHz increments.
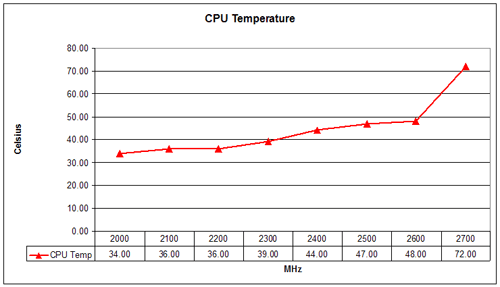
For those who prefer a graphical representation of the data, here are the charts for the above table.
It comes as no surprise that both the power draw and CPU temperatures increase as clock speed and voltage increase. The jump from 2.6 GHz to 2.7 GHz comes with a dramatic change in CPU temperature, and we would definitely advise against running this particular CPU at 2.7 GHz without additional cooling. Voltage and heat are good indicators of the maximum stable speed for a CPU, so if you're trying to find your own CPU's sweet spot, you can do so by increasing speed in 100 MHz increments. Run a few CPU intensive tests at each point to verify that the system is "stable" - Futuremark products are pretty good as an overall system stress test. Lather, rinse, and repeat. Slight increases in CPU voltage (and chipset voltage) will usually be required as the clock speed is raised, but eventually you reach a point where the next 100 MHz bump requires a substantial voltage change and comes with much higher temperatures.
Looking at our chart, you can see that most of the 100 MHz increases required a 0.00 to 0.050 CPU voltage increase. From 2.4 GHz to 2.6 GHz, we had to add 0.10V, but that's still not too bad. The last 100 MHz to reach 2.7 GHz required an additional 0.20V - four times as much per MHz as the previous step! We also tried every voltage from 1.500V to the maximum 1.850V and were unable to get the system fully stable at 2.7 GHz. That's a lot of voltage for a CPU rated at 1.300V, but we gave it a shot anyway. For most people, we'd say 1.500V is the safe limit on air cooling, though some people will feel okay pushing a bit further. We also recommend that you try to keep 90nm AMD chip temperatures under 50 degrees C. As you can see, the 2.7 GHz speed exceeds both of these thresholds, and it doesn't even do so with full stability. 2.6 GHz, on the other hand. falls in line with these limits and ran without any difficulty - at least with our particular setup.
One final note is that the power draw and temperatures can vary a lot with the task. Most games showed similar maximum power draw to 3DMark05 in informal testing, but usually only under high-stress situations. HL2 ranged from about 205W maximum at 800x600 0xAA to 262W maximum at 1600x1200 4xAA (with a CPU clock speed of 2.20 GHz). The average power draw under load was also quite a bit lower than the peak values reported; generally, average power was 15 to 25 Watts lower than the maximum.
By the way, yes, we are aware that measuring power at the outlet is not the same as measuring the output power of the PSU. Power supply inefficiencies come into play, but since we're only using one PSU (and this isn't a power supply test), the numbers are still valid. An inefficient power supply will draw more power from the wall, but the results shown are internally consistent.
One area that we overlooked last time was the system power draw as well as the CPU temperature. We spent some additional time measuring these items with the X2. Total power draw was measured at the wall using a Kill-A-Watt device. We used a batch file to run 3DMark03, 3DMark05, PCMark04, and PCMark05 sequentially. The maximum power draw invariably came during 3DMark05, with all three game tests falling very close together. Test 1 (Return to Proxycon) and test 2 (Firefly Forest) typically registered a few Watts higher than test 3 (Canyon Flight ), though this trend may not hold with other system configurations. Also, since we were overclocking, AMD's Cool 'n Quiet feature was disabled - it tends to interfere with overclocking efforts.
In addition to measuring the power draw, we used NVIDIA's nTune System Monitor to record temperatures of the chipset and processor. While we would be hesitant to use the results from nTune across different motherboards due to potential variance, since we are only using one motherboard, the values are measured consistently. The temperatures were measured using the same series of tests, with the 3DMark05 CPU test causing the highest recorded temperatures. (Note that the benchmark results for Futuremark products were collected in a separate run of these tests so that nTune wouldn't impact the results.)
We only recorded temperatures and power draw for one configuration, using the OCZ VX RAM - staring at a Watt meter for 20 minutes per configuration was already bad enough! Informal checks on other configurations showed that the results were consistent - additional RAM in the 2GB configurations drew a bit more power, but CPU and chipset temperatures were within 1 degree Celsius. Also, unlike the remaining benchmarks, we verified the voltage requirements, power draw, and temperatures at every setting in 100 MHz increments.
| Power and Temperatures | |||||
| OCZ Gold VX PC4000 2x512MB | |||||
| CPU Clock | CPU Voltage | CPU Temp | Chipse Voltage | Chipset Temp | System Power Draw |
| 2000 | 1.300 | 34.00 | 1.50 | 38 | 248 |
| 2100 | 1.350 | 36.00 | 1.50 | 38 | 260 |
| 2200 | 1.350 | 36.00 | 1.50 | 38 | 262 |
| 2300 | 1.350 | 39.00 | 1.50 | 38 | 266 |
| 2400 | 1.400 | 44.00 | 1.60 | 39 | 275 |
| 2500 | 1.475 | 47.00 | 1.60 | 39 | 290 |
| 2600 | 1.500 | 48.00 | 1.60 | 41 | 298 |
| 2700 | 1.700 | 72.00 | 1.70 | 47 | 369 |
For those who prefer a graphical representation of the data, here are the charts for the above table.
It comes as no surprise that both the power draw and CPU temperatures increase as clock speed and voltage increase. The jump from 2.6 GHz to 2.7 GHz comes with a dramatic change in CPU temperature, and we would definitely advise against running this particular CPU at 2.7 GHz without additional cooling. Voltage and heat are good indicators of the maximum stable speed for a CPU, so if you're trying to find your own CPU's sweet spot, you can do so by increasing speed in 100 MHz increments. Run a few CPU intensive tests at each point to verify that the system is "stable" - Futuremark products are pretty good as an overall system stress test. Lather, rinse, and repeat. Slight increases in CPU voltage (and chipset voltage) will usually be required as the clock speed is raised, but eventually you reach a point where the next 100 MHz bump requires a substantial voltage change and comes with much higher temperatures.
Looking at our chart, you can see that most of the 100 MHz increases required a 0.00 to 0.050 CPU voltage increase. From 2.4 GHz to 2.6 GHz, we had to add 0.10V, but that's still not too bad. The last 100 MHz to reach 2.7 GHz required an additional 0.20V - four times as much per MHz as the previous step! We also tried every voltage from 1.500V to the maximum 1.850V and were unable to get the system fully stable at 2.7 GHz. That's a lot of voltage for a CPU rated at 1.300V, but we gave it a shot anyway. For most people, we'd say 1.500V is the safe limit on air cooling, though some people will feel okay pushing a bit further. We also recommend that you try to keep 90nm AMD chip temperatures under 50 degrees C. As you can see, the 2.7 GHz speed exceeds both of these thresholds, and it doesn't even do so with full stability. 2.6 GHz, on the other hand. falls in line with these limits and ran without any difficulty - at least with our particular setup.
One final note is that the power draw and temperatures can vary a lot with the task. Most games showed similar maximum power draw to 3DMark05 in informal testing, but usually only under high-stress situations. HL2 ranged from about 205W maximum at 800x600 0xAA to 262W maximum at 1600x1200 4xAA (with a CPU clock speed of 2.20 GHz). The average power draw under load was also quite a bit lower than the peak values reported; generally, average power was 15 to 25 Watts lower than the maximum.
By the way, yes, we are aware that measuring power at the outlet is not the same as measuring the output power of the PSU. Power supply inefficiencies come into play, but since we're only using one PSU (and this isn't a power supply test), the numbers are still valid. An inefficient power supply will draw more power from the wall, but the results shown are internally consistent.


46 Comments
View All Comments
Puddleglum - Wednesday, December 21, 2005 - link
Neermind.. read this in the closing thoughts:"There is one other point to mention on the memory: overclocking with four 512MB DIMMs was almost a complete failure on the setup that we used. Other motherboards, or perhaps a BIOS update for this motherboard, might improve the results, but for now we would recommend caution with such attempts. If you want to run 2GB of RAM, two 1GB DIMMs would be a much better choice."
Good info.
bobsmith1492 - Wednesday, December 21, 2005 - link
Actually, switching supply efficiencies can change dramatically with load; I wouldn't count on the draw at the wall as a good indicator of system load change. The efficiency may change from, say 70% at half-load to 85% at 3/4 load, which, on a 400 watt supply, would show up as: 285.7 watts draw (lower power) and 352.9 watts draw (high power). Now, the system is drawing 50% more power, while the meter is only showing 23.5% more power draw.Something to keep in mind anyway as I don't know exactly what the difference in efficiency for that particular supply is....
Cerb - Wednesday, December 21, 2005 - link
It would be nice to know. However, if it's like the 470w one, it is 'close enough' at all loads.http://www.silentpcreview.com/article173-page4.htm...">http://www.silentpcreview.com/article173-page4.htm...
bobsmith1492 - Wednesday, December 21, 2005 - link
Yeah, from 2-400W it's pretty close. Nevermind me then. :)WRXSTI - Wednesday, December 21, 2005 - link
I cannot wait to get a 64 X2 chip! Maybe by next year is better...Futurebobis - Thursday, December 1, 2022 - link
Yo, sup past people