Investigations into Socket 939 Athlon 64 Overclocking
by Jarred Walton on October 3, 2005 4:35 PM EST- Posted in
- CPUs
RAM BIOS Settings
The final area that will need attention with overclocking is the RAM. The type of RAM used will dictate the approach to overclocking that RAM.
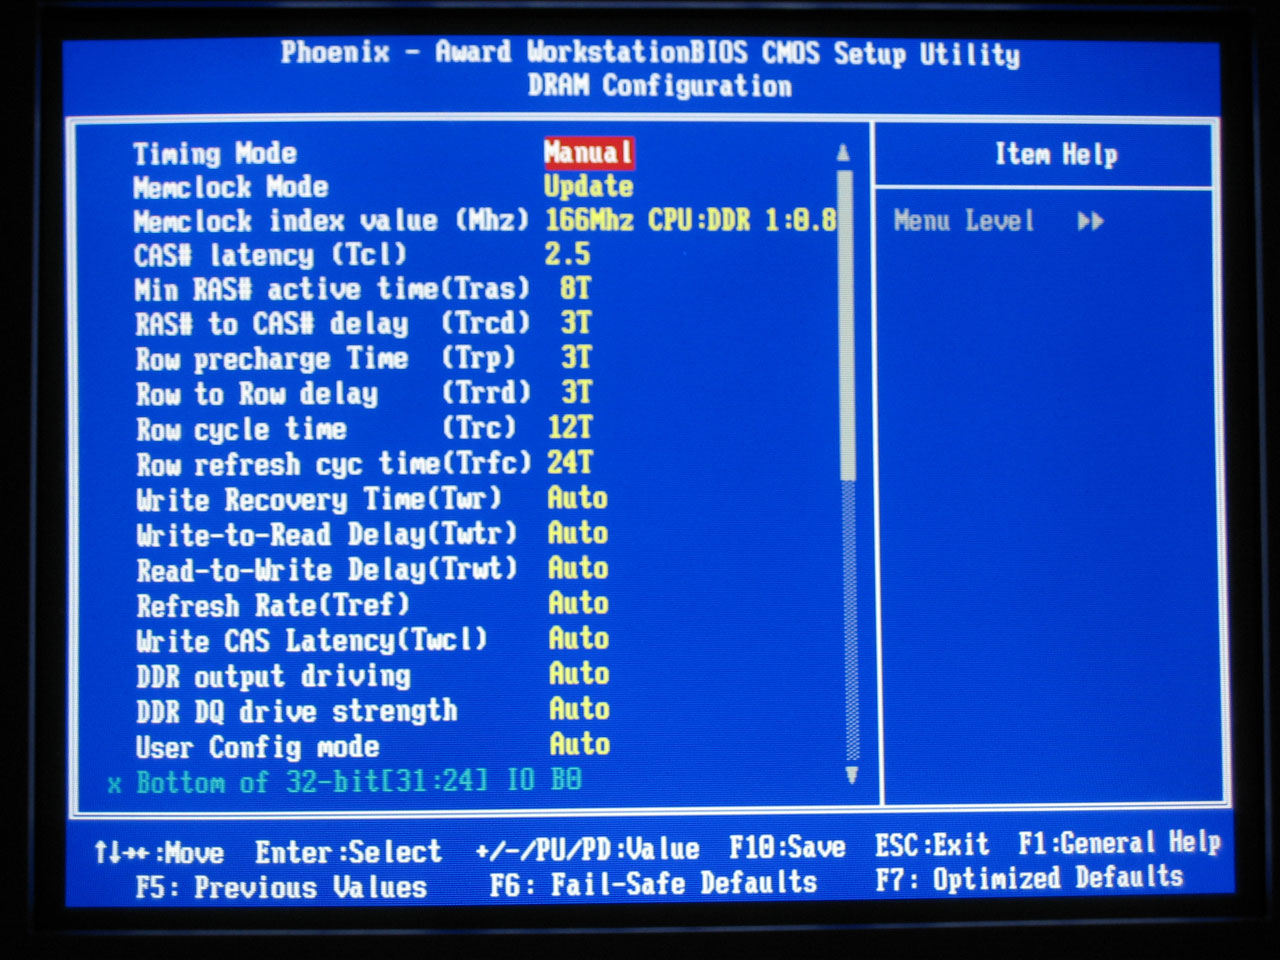
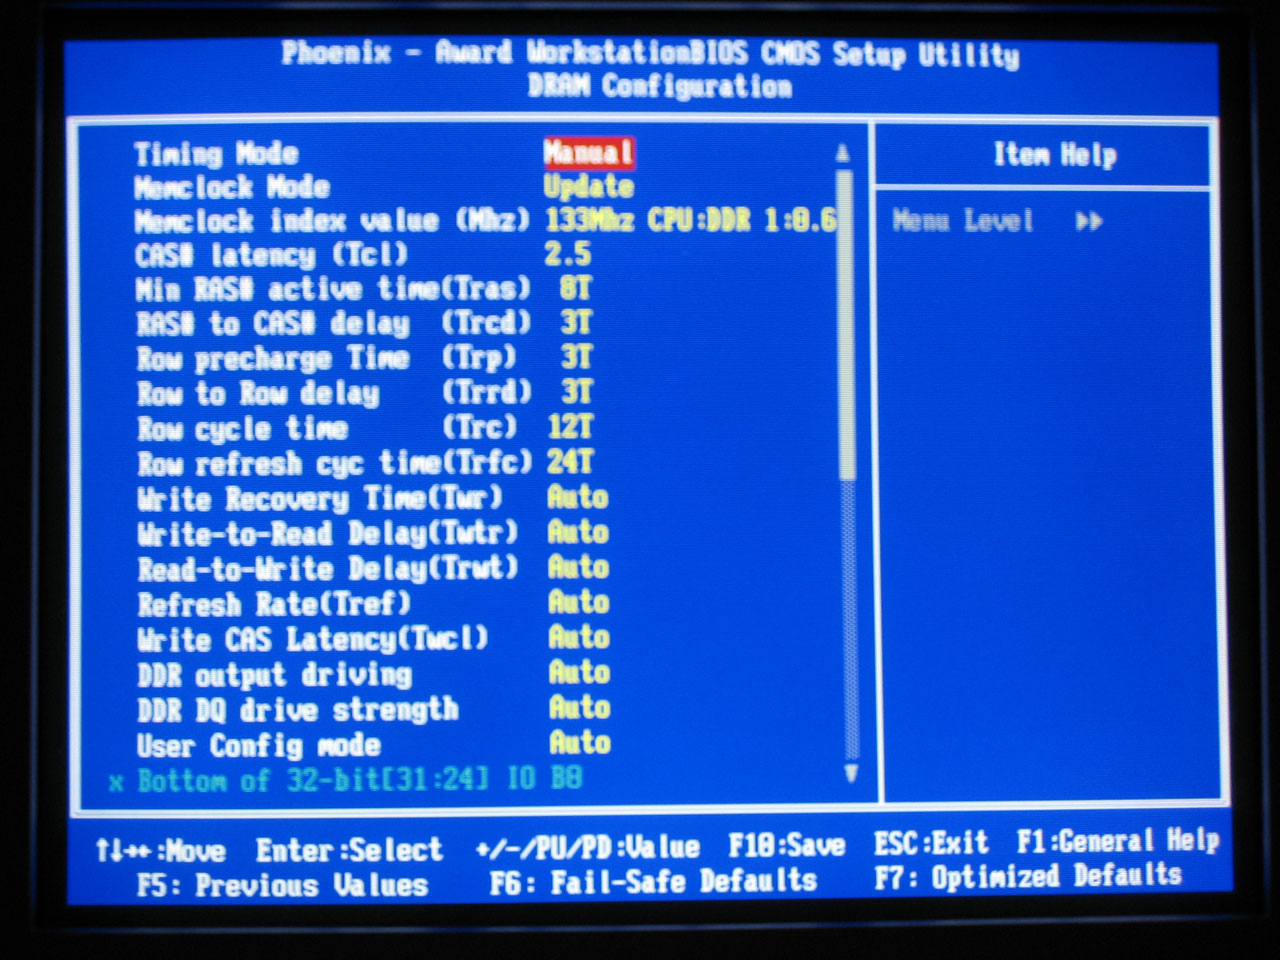
Even if you select the slowest possible timings, some DIMMs won't be able to run much above DDR400 speeds. Value RAM in particular is often what is left after all the high speed blanks are binned out, which is why it can be as cheap as half the cost of quality RAM. The above BIOS screens show our settings for 9x300 with the value and performance RAM - you can see that we had to drop to DDR266 vs. DDR333, since not even the OCZ ran optimally at DDR600. (At least, that's what we needed on this particular board with this particular set of DIMMs. 3-4-4-8 with 2T command rate worked, but was slower than DDR333 2.5-3-3-8 with 1T.) If you're going for top performance, value RAM is a poor choice. If, on the other hand, you want to save money, $85 RAM is a lot more attractive than $150+ RAM. The trick to using value RAM is that you basically have to keep it at or below DDR400 speeds, and this is accomplished by the use of memory ratios. There's a stigma against using higher memory ratios, because it "negates the performance gain." That can be true on some platforms, but it doesn't seem to affect Athlon 64 quite as much due to the integrated memory controller. Let's talk about why.
On the P4 chipsets, the NB talks to the CPU at one speed, and it can talk to RAM at a slower or faster speed. If it talks to RAM faster than it talks to the CPU (i.e. DDR2-533 or DDR2-667 with FSB800), there will be fewer "empty trains" going to the CPU. If it talks slower to the RAM than the FSB, however, there will be more empty slots on the FSB. When we look at Pentium overclocking in the future, we'll cover this more, but the basic idea is that you want the RAM to run at FSB speed or faster if at all possible. Dropping even to DDR333 (which is actually DDR320 for most Intel chipsets) can cause a 5 to 10% performance loss, and DDR266 would be even worse. So, why is Athlon 64 different?
An interesting corollary to the above discussion is in the Northbridge link of AMD vs. Intel. On AMD, the Northbridge is connected via the HyperTransport link. Running at 1000 MHz base (double-pumped makes it equivalent to 2000 MHz), the HT bus is 16-bits wide (2 bytes) with dedicated upstream and downstream links. All told, that gives:
The net result is that while a lower RAM clock speed can still impact performance on Athlon 64 systems, it will not do so as much as on a P4 style configuration. That's the theory, anyway, and we hope to support it with results from several planned overclocking articles.
To illustrate the above points, we've created a brief list of cycle rates and timings of RAM. We'll start with some common RAM speeds, but the actual speed of your RAM will depend on the CPU multiplier and CPU bus speed, among other things. With the clock speeds and timings, we can also calculate the latency and estimate the total memory latency. Remember that the RAM timings are relative to the base bus speed, not the doubled speed, so DDR400 has a 200MHz base clock speed. There is also latency involved internally in the CPU (typically at least a single RAM cycle each way is spent in the memory controller), as well as in sending the address request across the memory bus and receiving the data back across the bus to the CPU (we guessed at two RAM cycles each way). Command rate adds another cycle, and maybe we're wrong or missed some other potential delays.
Everything takes time, and the memory timings generally only reflect the delays caused internally by the RAM. Different clock speeds and timings should produce a different total latency, and we estimate the total memory subsystem latency below. We'll check the actual latency in our benchmarks later. In practice, going from DDR200 to DDR400 RAM will not cut the RAM latency in half, even at the same timings. For reference, our estimated latency is calculated as:
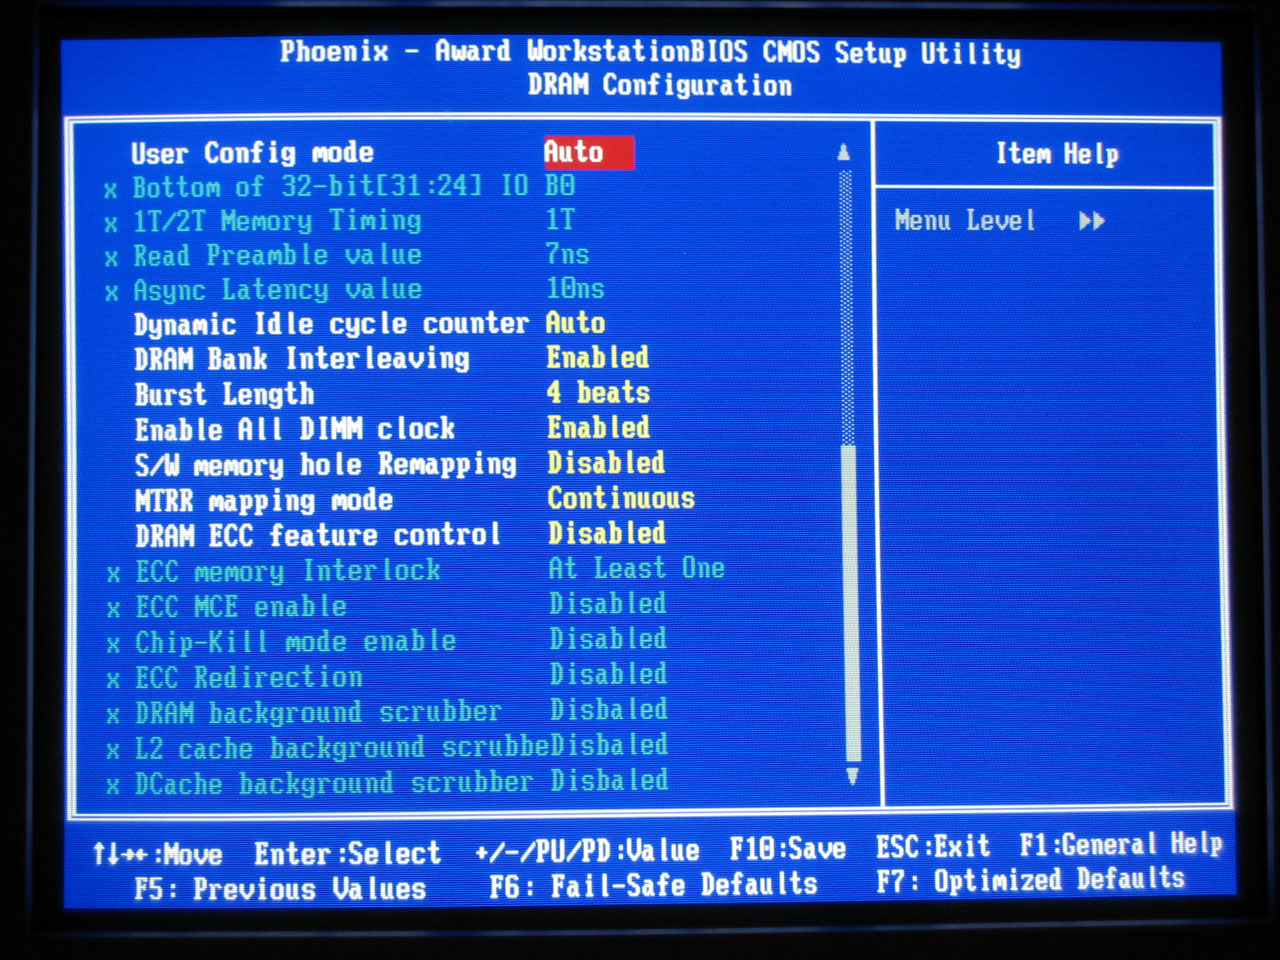
Even with all this information, we haven't even come close to touching on every BIOS option or memory timing that's available. That is, simply put, beyond the scope of this article. There are over a dozen memory timings listed in the DFI BIOS, and we left the majority of them set to Auto. The only items that we changed are CAS, tRCD, tRP, tRAS, and CMD. We may try to look at the other options in the future, but most of the extra settings are not available on the majority of the motherboards, and we want the information contained in this OC Guide to be applicable to more than just the "elite" motherboards.
The final area that will need attention with overclocking is the RAM. The type of RAM used will dictate the approach to overclocking that RAM.
Click to enlarge.
 |
 |
| Click to enlarge. | |
Even if you select the slowest possible timings, some DIMMs won't be able to run much above DDR400 speeds. Value RAM in particular is often what is left after all the high speed blanks are binned out, which is why it can be as cheap as half the cost of quality RAM. The above BIOS screens show our settings for 9x300 with the value and performance RAM - you can see that we had to drop to DDR266 vs. DDR333, since not even the OCZ ran optimally at DDR600. (At least, that's what we needed on this particular board with this particular set of DIMMs. 3-4-4-8 with 2T command rate worked, but was slower than DDR333 2.5-3-3-8 with 1T.) If you're going for top performance, value RAM is a poor choice. If, on the other hand, you want to save money, $85 RAM is a lot more attractive than $150+ RAM. The trick to using value RAM is that you basically have to keep it at or below DDR400 speeds, and this is accomplished by the use of memory ratios. There's a stigma against using higher memory ratios, because it "negates the performance gain." That can be true on some platforms, but it doesn't seem to affect Athlon 64 quite as much due to the integrated memory controller. Let's talk about why.
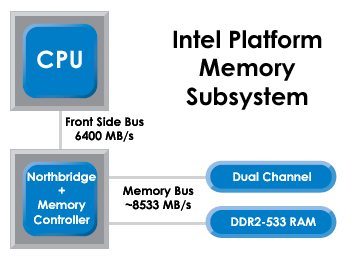
On the P4 chipsets, the NB talks to the CPU at one speed, and it can talk to RAM at a slower or faster speed. If it talks to RAM faster than it talks to the CPU (i.e. DDR2-533 or DDR2-667 with FSB800), there will be fewer "empty trains" going to the CPU. If it talks slower to the RAM than the FSB, however, there will be more empty slots on the FSB. When we look at Pentium overclocking in the future, we'll cover this more, but the basic idea is that you want the RAM to run at FSB speed or faster if at all possible. Dropping even to DDR333 (which is actually DDR320 for most Intel chipsets) can cause a 5 to 10% performance loss, and DDR266 would be even worse. So, why is Athlon 64 different?
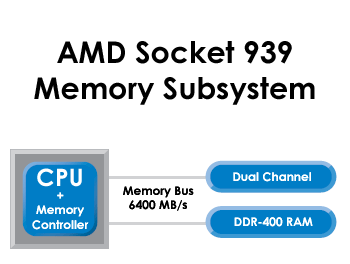
An interesting corollary to the above discussion is in the Northbridge link of AMD vs. Intel. On AMD, the Northbridge is connected via the HyperTransport link. Running at 1000 MHz base (double-pumped makes it equivalent to 2000 MHz), the HT bus is 16-bits wide (2 bytes) with dedicated upstream and downstream links. All told, that gives:
2000 MHz * 2 bytes = 4000 MB/sThe total HT bandwidth is thus 8000 MB/s - 4000 MB/s in each direction. Here's the catch, though: this bandwidth is separate from the memory bandwidth. If you've ever tried overclocking the HT bus speed and found the results to be of little help, performance-wise, that should hopefully clear things up. There is rarely (if ever) 4 GB/s of data in either direction between the CPU and Northbridge. It's like putting an eight-lane highway through a rural farming community; since there's very little traffic to begin with, the extra lanes (bandwidth) won't help much. That's not to say this is a poor design decision - better to have too much available bandwidth than not enough! The P4 design doesn't suffer from a lack of bandwidth either; the problem is that the time in which it takes to get data from the RAM to the CPU is quite a bit longer - in other words, higher latencies.
The net result is that while a lower RAM clock speed can still impact performance on Athlon 64 systems, it will not do so as much as on a P4 style configuration. That's the theory, anyway, and we hope to support it with results from several planned overclocking articles.
To illustrate the above points, we've created a brief list of cycle rates and timings of RAM. We'll start with some common RAM speeds, but the actual speed of your RAM will depend on the CPU multiplier and CPU bus speed, among other things. With the clock speeds and timings, we can also calculate the latency and estimate the total memory latency. Remember that the RAM timings are relative to the base bus speed, not the doubled speed, so DDR400 has a 200MHz base clock speed. There is also latency involved internally in the CPU (typically at least a single RAM cycle each way is spent in the memory controller), as well as in sending the address request across the memory bus and receiving the data back across the bus to the CPU (we guessed at two RAM cycles each way). Command rate adds another cycle, and maybe we're wrong or missed some other potential delays.
Everything takes time, and the memory timings generally only reflect the delays caused internally by the RAM. Different clock speeds and timings should produce a different total latency, and we estimate the total memory subsystem latency below. We'll check the actual latency in our benchmarks later. In practice, going from DDR200 to DDR400 RAM will not cut the RAM latency in half, even at the same timings. For reference, our estimated latency is calculated as:
7 * (Cycle Latency) + CL + 0.1 * tRCD + 0.05 * tRPIt would be different for other platforms, and it's probably off by as much as 20%, we'd guess. The "7" represents the command rate, CPU to memory controller delays, and memory controller to RAM delays. We did use some tests to try to come up with a good estimate, but take the estimated latency in the following table with a serious dose of skepticism. For a P4 platform, the major change is that the inclusion of the NB will change the "7" factor to something much larger - perhaps 14 to 20. (We'll look at that in a future article.)
| RAM Speeds; Timings and Theoretical Latencies | |||||||||||
| RAM Rating | Base Speed | ns per cycle | CAS | tRCD | tRP | tRAS | CL ns | tRCD ns | tRP ns | tRAS ns | Estimated Latency |
| DDR266 | 133.33 | 7.5 | 2 | 2 | 2 | 5 | 15 | 15 | 15 | 37.5 | 69.75 |
| DDR266 | 133.33 | 7.5 | 2.5 | 3 | 3 | 7 | 18.75 | 22.5 | 22.5 | 52.5 | 74.63 |
| DDR266 | 133.33 | 7.5 | 3 | 4 | 4 | 8 | 22.5 | 30 | 30 | 60 | 79.5 |
| DDR333 | 166.67 | 6 | 2 | 2 | 2 | 5 | 12 | 12 | 12 | 30 | 55.8 |
| DDR333 | 166.67 | 6 | 2.5 | 3 | 3 | 7 | 15 | 18 | 18 | 42 | 59.7 |
| DDR333 | 166.67 | 6 | 3 | 4 | 4 | 8 | 18 | 24 | 24 | 48 | 63.6 |
| DDR400 | 200 | 5 | 2 | 2 | 2 | 5 | 10 | 10 | 10 | 25 | 46.5 |
| DDR400 | 200 | 5 | 2.5 | 3 | 3 | 7 | 12.5 | 15 | 15 | 35 | 49.75 |
| DDR400 | 200 | 5 | 3 | 4 | 4 | 8 | 15 | 20 | 20 | 40 | 53 |
| DDR450 | 225 | 4.44 | 2 | 2 | 2 | 5 | 8.89 | 8.89 | 8.89 | 22.22 | 41.33 |
| DDR450 | 225 | 4.44 | 2.5 | 3 | 3 | 7 | 11.11 | 13.33 | 13.33 | 31.11 | 44.22 |
| DDR450 | 225 | 4.44 | 3 | 4 | 4 | 8 | 13.33 | 17.78 | 17.78 | 35.56 | 47.11 |
| DDR500 | 250 | 4 | 2 | 2 | 2 | 5 | 8 | 8 | 8 | 20 | 37.2 |
| DDR500 | 250 | 4 | 2.5 | 3 | 3 | 7 | 10 | 12 | 12 | 28 | 39.8 |
| DDR500 | 250 | 4 | 3 | 4 | 4 | 8 | 12 | 16 | 16 | 32 | 42.4 |
Even with all this information, we haven't even come close to touching on every BIOS option or memory timing that's available. That is, simply put, beyond the scope of this article. There are over a dozen memory timings listed in the DFI BIOS, and we left the majority of them set to Auto. The only items that we changed are CAS, tRCD, tRP, tRAS, and CMD. We may try to look at the other options in the future, but most of the extra settings are not available on the majority of the motherboards, and we want the information contained in this OC Guide to be applicable to more than just the "elite" motherboards.


101 Comments
View All Comments
intellon - Tuesday, October 4, 2005 - link
I understand how/why the memory quality is not too imoprtant (5-9% increase for 100 bucks = not worthy)What I AM unclear about is the cpu itself. Would all the cpu's based on venice hit a same ceiling. Or would a 3800+ reach a higher, more stable, cooler overclock than the 3200+? There is one line that mentions these two cpu's on the first page but no comment on how they would perform when overclocked. Does a 12x help over 9x? Also am I wrong in assuming that you picked 3200+ over 3000+ because of a higher multiplier?
And like people are asking... how bad/good are the other chips? How'll a San Diego 3500+ fare against a Venice 3500+? They're faster as stock, but can they match or exceed overclock performance of venice?
Questions questions questions...
The article was wicked though. I was skeptical about buying a cheaper RAM... but seeing how another $50 is not going to help, I'll save that money for something else.
gplracer - Tuesday, October 4, 2005 - link
Very nice article. It appears to be well thought out. Thanks for the time you spent on it. I would also be nice to have an article of this type with some of the more popular power supplies.I to have had several chips that would overclock such as:
P166 @ 200mhz lol
Celeron 300a @ 450mhz
Duron 600 @ 950mhz
Athlon 1700+ (DLTC3) @ 2374mhz
2600+ at 250x10= 2500mhz
There is no way you could add all of the cpus to the review. I look forward to overclocking a dual core athlon64.
PaBlooD - Tuesday, October 4, 2005 - link
Great Articule.. thanks for that great work.I actually have a A64 3200+ Winchester core with an Epox 9NDA3+ + 512 x2 ocz premier (crap ) and i only can get the procesor to 2150 mhz... i tried with safe memo times.. but nothing..are that bad overclockers the Winchester cores? :S
(excuse my poor english ^_^)
RaulAssis - Wednesday, December 21, 2005 - link
Didi you try memory deviders like 5/6 ?yacoub - Tuesday, October 4, 2005 - link
I definitely appreciate all the walk-through of overclocking an A64 system. Very good article. One thing though - the last few pages with the test result charts... the charts make it look like the entire notion of overclocking is rather pointless since all four colored lines are nearly identical in all but a couple tests. You might want to consider a different type of chart next time that gives a -visual- impression of the benefit to better support the written descriptive increases in performance. Maybe some sort of bar chart would have worked better.JarredWalton - Tuesday, October 4, 2005 - link
I felt the visual impression conveyed exactly what I saw: the difference between the 3000+ and 3200+ in overclocking combined with value and performance RAM is, at best, small. I understand what you're saying, and trust me: I played around with the Excel graphs for many hours. None of the graphs really gave a clear picture, unfortunately. Getting four setups with about 9 settings each into a single chart is messy. Having 80 charts is even worse. Heheh.If someone can show me a preferred chart style, I'll be happy to change the graph for the next installment. The AnandTech graphing engine really wasn't capable of dealing with this type of data set, unfortunately... but Excel was only marginally better.
intellon - Tuesday, October 4, 2005 - link
I guess you could "ZOOM IN" onto the y-axis. For instance: on the last graph HL2 1024x768 4xAA, since the minimum was above 80 and max was below 140, you could set the min and max ranges of y-axis accordingly. or go GNU plot way for a sharper graph.JarredWalton - Tuesday, October 4, 2005 - link
Like the 3DMark GPU scores? I really dislike graphs that don't start at 0, because it hides the reality. (That's why I put the extra paragraph on the 3DMark scores noting specifically that they don't start at 0.) I can blow up a graph so that everyone can see the 1 or 2% margin of victory, but what does that really say? Margin of error on several benchmarks is at least 1 or 2%, and in actual use I don't think anyone will really notice even a 5% difference - I know I don't.Some people will be annoyed by this, but too many people worry about the last 1% of performance. Not because they can notice a difference, but because they want meaningless bragging rights. Sitting in the top positions in an online game requires skill. Getting 1% higher FPS usually just involves throwing more money at your PC than the next guy. Some people like to do that - sort of like some people like muscle cars. I want a fast computer, but I'm not going to lose sleep because my PC is marginally slower than my friend's, you know?
Anyway, I may look into a separate graphing tool. Excel looks fine internally, but getting the graphs into image form didn't work perfectly. The text alignment got a little tweaked when I cut and pasted the data into Photoshop.
Regards,
Jarred Walton
RupertS - Wednesday, October 19, 2005 - link
Be careful, I think Muscle Car owners are a protected class.probedb - Tuesday, October 4, 2005 - link
I'd just like to say cheers for this. It's made me finally get round to trying to OC my system. I purposely bought a 3000+ and Crucial Ballistix for this but have never got round to trying it.I shall give it a go this weekend!!!