Investigations into Socket 939 Athlon 64 Overclocking
by Jarred Walton on October 3, 2005 4:35 PM EST- Posted in
- CPUs
System Settings
We have a bunch of screenshots from CPU-Z showing the CPU and Memory tabs, covering most of the settings that we used. Rather than linking 44 images, though, we're just going to provide a single Zip file of all the screens. One thing that became immediately clear is that the BIOS voltages were almost never reflected in the CPU-Z results. Which one is more accurate is impossible to say, short of busting out a voltmeter (and knowing where to attach it).
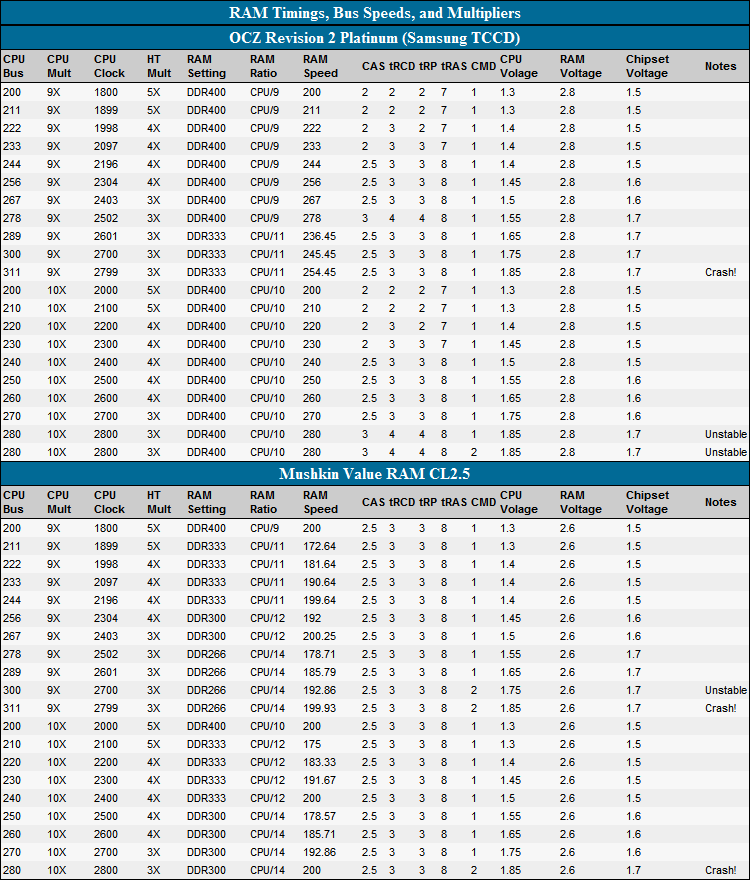
We did not remember to get a screenshot of every single configuration tested, since we went back to fill in the blanks on CPU performance after running the initial benchmarks. However, you can get the settings used in the following table. If you have a motherboard that doesn't support the same settings that we used, you may or may not be able to reach a specific overclock.
Disclaimer: Many of the tested voltages on the CPU are probably higher than necessary. After trying for 10x280 with up to the maximum voltage possible from the motherboard, I was probably a bit too lenient on turning voltages back to normal. These are more or less the settings I used during the testing - there may be a few errors in record keeping. If you are looking for long-term stability and you can get the system to run stable at 1.450V instead of 1.650V, that would be a wise decision. The results in the following table are merely intended as an initial reference point.
Note how CPU voltages scaled rapidly as we neared the highest overclock levels. We didn't spend a lot of time trying to get things running stably at a lower voltage level, so mostly, we went in .05V increments - again, you might be able to get better results. If we experienced a crash during our benchmarking, we would try to increase the CPU and/or chipset voltage to get the tests to run stable. If that didn't work, we resorted to tweaking memory timings, generally by increasing latencies until we found a stable setting. Once we went from CL2 to CL2.5, we didn't spend the time trying to get 2.5-2-2, 2.5-3-2, or anything other than 2.5-3-3 (or higher latencies) to run stably.
With our performance RAM, we kept it at a steady 2.8V setting. We did try 2.9V on some of the higher overclocks, particularly where we had to drop from the PC3200 to PC2700, but we couldn't get 1T timings at PC3200 above a 280 MHz CPU bus speed. The value RAM was kept at a steady 2.6V setting and 2.5-3-3-8-1T timings, except in a few cases where we had to run with 2T timings. We tried to get 3-4-4-8-1T instead, but at 9x300, we could not run the value RAM without the 2T setting.
You'll notice the "crash" and "unstable" comments on several of the highest overclock attempts. "Crash" means that we were unable to run many of the tests due to repeated lockups, reboots, etc. "Unstable" means that we were able to get benchmark results for all (or nearly all tests), but programs might crash at times. For example, Far Cry might crash at 1024x768 4xAA on the first attempt, but rebooting and starting again from that point would complete the tests. We tried to run all of the gaming benchmarks in order without rebooting, which will keep system temperatures higher than letting the GPU cool down for a couple of minutes while we reboot. We won't include the settings that crashed in our results, but we did include the unstable results. We'll be using these unstable settings for some cooling tests in the future to see if a change in HSF will help - and hopefully even allow higher overclocks.
A last comment is that we didn't fully benchmark all of the settings listed in the charts. We tested 1800, 2000, 2200, 2400, 2600, and 2700 MHz. We also tested 2800 MHz on a couple of configurations, although stability was iffy at best. In order to provide a linear scale (so that the results at 2700 aren't skewed), we interpolated the in-between scores. This is a problem with the graphing capability that we have within Excel. We did run some quick tests at each setting, though, just to verify that we could POST and complete PCMark04/PCMark05. In case you're wondering, the entire benchmark suite takes around 4 to 5 hours to complete. That will hopefully explain why we didn't run the additional tests or spend a lot of time fine-tuning each tested setting.
And now, on with the benchmarks.
We have a bunch of screenshots from CPU-Z showing the CPU and Memory tabs, covering most of the settings that we used. Rather than linking 44 images, though, we're just going to provide a single Zip file of all the screens. One thing that became immediately clear is that the BIOS voltages were almost never reflected in the CPU-Z results. Which one is more accurate is impossible to say, short of busting out a voltmeter (and knowing where to attach it).
We did not remember to get a screenshot of every single configuration tested, since we went back to fill in the blanks on CPU performance after running the initial benchmarks. However, you can get the settings used in the following table. If you have a motherboard that doesn't support the same settings that we used, you may or may not be able to reach a specific overclock.
Disclaimer: Many of the tested voltages on the CPU are probably higher than necessary. After trying for 10x280 with up to the maximum voltage possible from the motherboard, I was probably a bit too lenient on turning voltages back to normal. These are more or less the settings I used during the testing - there may be a few errors in record keeping. If you are looking for long-term stability and you can get the system to run stable at 1.450V instead of 1.650V, that would be a wise decision. The results in the following table are merely intended as an initial reference point.
Click to enlarge.
Note how CPU voltages scaled rapidly as we neared the highest overclock levels. We didn't spend a lot of time trying to get things running stably at a lower voltage level, so mostly, we went in .05V increments - again, you might be able to get better results. If we experienced a crash during our benchmarking, we would try to increase the CPU and/or chipset voltage to get the tests to run stable. If that didn't work, we resorted to tweaking memory timings, generally by increasing latencies until we found a stable setting. Once we went from CL2 to CL2.5, we didn't spend the time trying to get 2.5-2-2, 2.5-3-2, or anything other than 2.5-3-3 (or higher latencies) to run stably.
With our performance RAM, we kept it at a steady 2.8V setting. We did try 2.9V on some of the higher overclocks, particularly where we had to drop from the PC3200 to PC2700, but we couldn't get 1T timings at PC3200 above a 280 MHz CPU bus speed. The value RAM was kept at a steady 2.6V setting and 2.5-3-3-8-1T timings, except in a few cases where we had to run with 2T timings. We tried to get 3-4-4-8-1T instead, but at 9x300, we could not run the value RAM without the 2T setting.
You'll notice the "crash" and "unstable" comments on several of the highest overclock attempts. "Crash" means that we were unable to run many of the tests due to repeated lockups, reboots, etc. "Unstable" means that we were able to get benchmark results for all (or nearly all tests), but programs might crash at times. For example, Far Cry might crash at 1024x768 4xAA on the first attempt, but rebooting and starting again from that point would complete the tests. We tried to run all of the gaming benchmarks in order without rebooting, which will keep system temperatures higher than letting the GPU cool down for a couple of minutes while we reboot. We won't include the settings that crashed in our results, but we did include the unstable results. We'll be using these unstable settings for some cooling tests in the future to see if a change in HSF will help - and hopefully even allow higher overclocks.
A last comment is that we didn't fully benchmark all of the settings listed in the charts. We tested 1800, 2000, 2200, 2400, 2600, and 2700 MHz. We also tested 2800 MHz on a couple of configurations, although stability was iffy at best. In order to provide a linear scale (so that the results at 2700 aren't skewed), we interpolated the in-between scores. This is a problem with the graphing capability that we have within Excel. We did run some quick tests at each setting, though, just to verify that we could POST and complete PCMark04/PCMark05. In case you're wondering, the entire benchmark suite takes around 4 to 5 hours to complete. That will hopefully explain why we didn't run the additional tests or spend a lot of time fine-tuning each tested setting.
And now, on with the benchmarks.


101 Comments
View All Comments
DonTrowbridg3 - Thursday, October 4, 2018 - link
2018 checking in. Thanks for all the info and comments. Very helpful in overclocking my FX-60, A8N32-SLI, dual 8800 GTX