Beating the System: The AnandTech Guide to Economic Upgrading
by Kristopher Kubicki & Jarred Walton on January 30, 2005 5:59 PM EST- Posted in
- Guides
A Simple Example
Now that we have the basics on what a graphical model looks like and how it functions, let us see if we can construct something similar for actual components. For this example, we are going to rewind into the past six months and base all of our devaluation assumptions on actual data pulled from our RealTime Price Engine. Suppose our hypothetical machine to upgrade looks like the following:Processor: Athlon 64 2800+ Socket 754This machine clearly looks GPU limited, but we won't let that stop us from choosing a whole subset of new components for our price set. Since we just did an article on it, the goal in this example will be to spend around $200 for a computer upgrade in order to maximize Half Life 2 performance. Once again, we need to add some padding on each end of the $200 budget so that we can have some leeway when we introduce Time into the model. Our list of products is as follows:
Memory: 512MB DDR-400
Video Card: ATI Radeon 9600 Pro
Motherboard: MSI nForce3 K8N Neo-FSR
Processor: All Socket 754 Processors better than an Athlon 64 2800+
Video Card: All AGP video cards better than a Radeon 9600 Pro
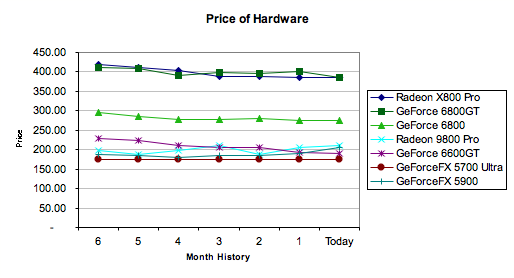
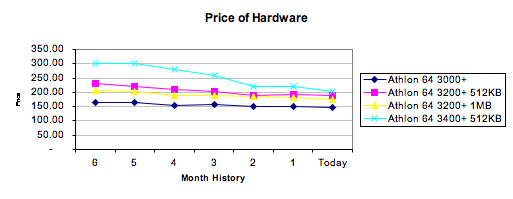
Let's plot as many of these components as possible on a graph denoting their price. We are slightly limited in our purchasing decision tree because we need to select components that fall within our designated price budget, but also components that are compatible with our hardware. This is a simple example, so we won't introduce components like memory, hard drives or motherboards for the time being. The prices were current prices as listed from the RealTime Price Engine. To keep our graphs neat, we separated video and graphics cards.
| Product | Price 6 Months Ago | Relative Quality | Product | Price 6 Months Ago | Relative Quality | |
| Radeon X800 Pro | $418.00 | 400.00% | Athlon 64 3000+ | $164.00 | 105.00% | |
| GeForce 6800GT | $412.00 | 400.00% | Athlon 64 3200+ 512KB | $230.00 | 108.00% | |
| GeForce 6800 | $295.00 | 260.00% | Athlon 64 3200+ 1MB | $205.00 | 110.00% | |
| Radeon 9800 Pro | $197.00 | 200.00% | Athlon 64 3400+ 512KB | $300.00 | 113.00% | |
| GeForce 6600GT | $228.00 | 240.00% | ||||
| GeForceFX 5700 Ultra | $175.00 | 100.00% | ||||
| GeForceFX 5900XT | $187.00 | 170.00% | ||||
This is a simple example geared toward a single application, so take these numbers with a grain of salt. You can see that we simply marked average FPS percentage increase as our quantitative values for Quality, but if we introduce more applications into our objective, we will have to use different values for Quality. We have placed some fairly conservative estimates on the relative quality between each component, but we cheated a little with the GeForce 6600GT and used the PCI Express pricing instead to demonstrate the model.
Below, you can see the actual price of each component as it changed throughout the last six months (The 6600GT is using PCIe pricing).
This looks real interesting, particularly with the subtle price swaps between each video card in the $200 segment. Now, we are just going to tilt the axis a little bit as we introduce our CNU variable of $0.25 again. After all, if our time is worthless, what is the point in upgrading this century?
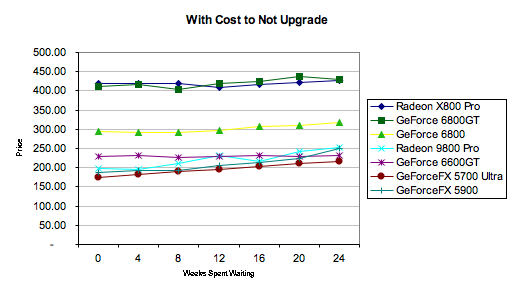
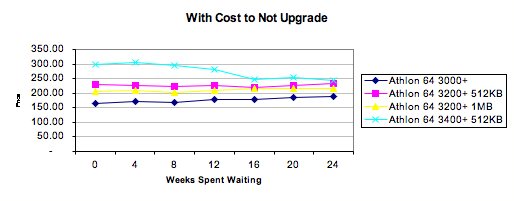
Things are looking really smooth now. In every instance, it is cheaper to buy today rather than buy tomorrow when we consider the $0.25 per day that it costs us to suffer through another agonizing frag fest at substandard performance. Finally, we just need to introduce quality into the equation and see which of these components maximizes our value, and when.

Click to enlarge.

Click to enlarge.
August 30, 2004 would have been a particularly fun day to determine an upgrade for a new system. In retrospect, the best card to purchase at that date would have been the GeForce 6600GT – but as we mentioned earlier, we flubbed the data a little bit for that video card, since only the PCIe version existed at that point. The second best performing card, for the dollar, was the Radeon 9800 Pro. We didn't even need to consider the higher end cards, since the laws of diminishing returns automatically compensated. Since the Radeon 9800 Pro is an older SKU and its price has been relatively static, it quickly falls off the board as the best value card, but it still has a higher Price to Quality ratio than anything else around $200 – including CPUs.
All of the data from this page can be viewed in the Excel workbook here.


50 Comments
View All Comments
Googer - Sunday, January 30, 2005 - link
Just kidding, a very nice article.Googer - Sunday, January 30, 2005 - link
they just renamed the site AnandsHardwareGuide.combenk - Sunday, January 30, 2005 - link
There is a superfluous space which breaks the link for the excel sheet on page 3.archcommus87 - Sunday, January 30, 2005 - link
I'm amazed that this can actually apply too much in the real world. Seems like too many numbers are fudged/made up, such as cost per day, or the quality percentages.faboloso112 - Sunday, January 30, 2005 - link
it would certainly be nice to have a plug-n-chug sorta setup so we can download the app and run it and figure out what should be our next upgrade...but nonetheless...this is a very solid article...and plus im sure that making such a prog wont exactly be the easiest thing in the world. but still...if you did make such a prog you'd be helping thousands of people make a good choice when upgrading. and if not you Kristopher...maybe Anand or even an AT member could perhaps take up this little project?once again...great article...keep up the great work!!
xsilver - Sunday, January 30, 2005 - link
right on #4 -- some noobs here may read that and go "what's a model? is it much like a supermodel?" :DPostoasted - Sunday, January 30, 2005 - link
The article reminded me of an econometric class I sat in on in college. For me, a click-thru decision menu would be more practical. Generally speaking, the menu would start with one's present computing environment and uses with time/cost analysis calculated for each performance unit-increase in efficiency.ChrisChiasson - Sunday, January 30, 2005 - link
Some of your graphs are labeled "Price to Quality", where the GeForce 6600 has the highest series range on the entire time domain. The graphs should be labeled "Quality to Price", if the GeForce is the best upgrade.1 to 2 = 0.5
2 to 1 = 2.0
...
zetto - Sunday, January 30, 2005 - link
all these stuff make my head hurt.... Give us a calculator please :Dcryptonomicon - Sunday, January 30, 2005 - link
Thanks for doing this for me in the "Buyer's Guide" so I don't have to.