Beating the System: The AnandTech Guide to Economic Upgrading
by Kristopher Kubicki & Jarred Walton on January 30, 2005 5:59 PM EST- Posted in
- Guides
A Simple Example
Now that we have the basics on what a graphical model looks like and how it functions, let us see if we can construct something similar for actual components. For this example, we are going to rewind into the past six months and base all of our devaluation assumptions on actual data pulled from our RealTime Price Engine. Suppose our hypothetical machine to upgrade looks like the following:Processor: Athlon 64 2800+ Socket 754This machine clearly looks GPU limited, but we won't let that stop us from choosing a whole subset of new components for our price set. Since we just did an article on it, the goal in this example will be to spend around $200 for a computer upgrade in order to maximize Half Life 2 performance. Once again, we need to add some padding on each end of the $200 budget so that we can have some leeway when we introduce Time into the model. Our list of products is as follows:
Memory: 512MB DDR-400
Video Card: ATI Radeon 9600 Pro
Motherboard: MSI nForce3 K8N Neo-FSR
Processor: All Socket 754 Processors better than an Athlon 64 2800+
Video Card: All AGP video cards better than a Radeon 9600 Pro
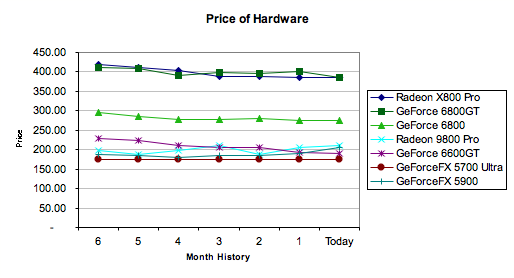
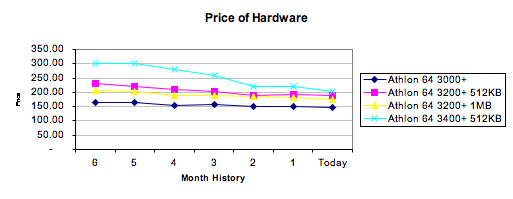
Let's plot as many of these components as possible on a graph denoting their price. We are slightly limited in our purchasing decision tree because we need to select components that fall within our designated price budget, but also components that are compatible with our hardware. This is a simple example, so we won't introduce components like memory, hard drives or motherboards for the time being. The prices were current prices as listed from the RealTime Price Engine. To keep our graphs neat, we separated video and graphics cards.
| Product | Price 6 Months Ago | Relative Quality | Product | Price 6 Months Ago | Relative Quality | |
| Radeon X800 Pro | $418.00 | 400.00% | Athlon 64 3000+ | $164.00 | 105.00% | |
| GeForce 6800GT | $412.00 | 400.00% | Athlon 64 3200+ 512KB | $230.00 | 108.00% | |
| GeForce 6800 | $295.00 | 260.00% | Athlon 64 3200+ 1MB | $205.00 | 110.00% | |
| Radeon 9800 Pro | $197.00 | 200.00% | Athlon 64 3400+ 512KB | $300.00 | 113.00% | |
| GeForce 6600GT | $228.00 | 240.00% | ||||
| GeForceFX 5700 Ultra | $175.00 | 100.00% | ||||
| GeForceFX 5900XT | $187.00 | 170.00% | ||||
This is a simple example geared toward a single application, so take these numbers with a grain of salt. You can see that we simply marked average FPS percentage increase as our quantitative values for Quality, but if we introduce more applications into our objective, we will have to use different values for Quality. We have placed some fairly conservative estimates on the relative quality between each component, but we cheated a little with the GeForce 6600GT and used the PCI Express pricing instead to demonstrate the model.
Below, you can see the actual price of each component as it changed throughout the last six months (The 6600GT is using PCIe pricing).
This looks real interesting, particularly with the subtle price swaps between each video card in the $200 segment. Now, we are just going to tilt the axis a little bit as we introduce our CNU variable of $0.25 again. After all, if our time is worthless, what is the point in upgrading this century?
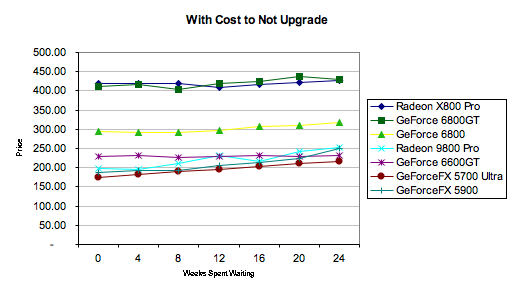
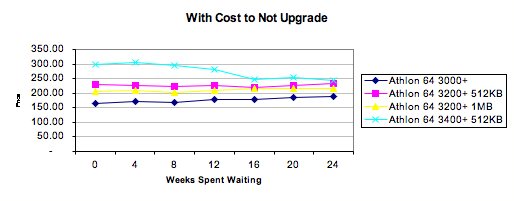
Things are looking really smooth now. In every instance, it is cheaper to buy today rather than buy tomorrow when we consider the $0.25 per day that it costs us to suffer through another agonizing frag fest at substandard performance. Finally, we just need to introduce quality into the equation and see which of these components maximizes our value, and when.

Click to enlarge.

Click to enlarge.
August 30, 2004 would have been a particularly fun day to determine an upgrade for a new system. In retrospect, the best card to purchase at that date would have been the GeForce 6600GT – but as we mentioned earlier, we flubbed the data a little bit for that video card, since only the PCIe version existed at that point. The second best performing card, for the dollar, was the Radeon 9800 Pro. We didn't even need to consider the higher end cards, since the laws of diminishing returns automatically compensated. Since the Radeon 9800 Pro is an older SKU and its price has been relatively static, it quickly falls off the board as the best value card, but it still has a higher Price to Quality ratio than anything else around $200 – including CPUs.
All of the data from this page can be viewed in the Excel workbook here.


50 Comments
View All Comments
Jedi2155 - Monday, January 31, 2005 - link
Anand should really have a VGA and a CPU chart of some sort as well! I don't really trust tomshardware all that much.But then, most of us don't anyways :P.
I like the article and its calculations tho...believe it or not....i use similar ones....
kmmatney - Monday, January 31, 2005 - link
sorry about the third post - but there is one statement that I think hits the nail on the head:"Determining the exact performance increase from a Radeon 9600 Pro to a Radeon X850XT is not something that you'll readily see published on AnandTech or anywhere else."
We can "almost" get this from Toms Hardware, from the VGA charts.
http://graphics.tomshardware.com/graphic/20041004/...
They don't have half-life 2, but there are enough benchmarks to at least allow for an informed decision. In fact, I used the article to help a friend buy a Radeon 9600 Pro, which was the best bang-for-buck at the time.
Why can't Anandtech have something similar, or the ability to create a similar graph on demand? Having the ability to chart both video card and cpu upgrades would be the ultimate tool for the upgrader.
kmmatney - Monday, January 31, 2005 - link
This article reminds me of something I always wanted. The ability to pull up benchmarks dynamically. I could put in my system specs, or select a similar procesor from a list. Untested speeds can be estimated to first order. Then I could pull up benchmarks from different video cards and compare exactly what I want.For now, I use the Toms Hardware video charts, as Anandtech doesn't have anything so comprehensive. A "Real-Time benchmark Engine" would be awesome for this.
kmmatney - Monday, January 31, 2005 - link
I'm a bit qith #19. It pains me to pay more than ~$100 for a video card. My plan was to stay with my Ti4200, but I managed to Ebay off $120 in old hardware last week, which brings my 6600GT upgrade down to an affordable $90, minus whatever nmy old card sells for. I'm definately sticking with my Athlon XP for a while, though.roostercrows - Monday, January 31, 2005 - link
excellent article kristopher, as i have had all the components for my new anandtech high end computer (except the video cards) just sitting on my bench for three months now just waiting... i can't help but think about what a price gouging graph would look like for the 6800gt pci-e sli video cards......Googer - Monday, January 31, 2005 - link
#13, I agree; but for some of us doing cost benefit analysis is part of the fun too. I really enjoy doing my mathmatics when I have the opertunity to do so. For me It is all part of the research that goes in to learning about new hardware. Its a hobby for me too.JarredWalton - Monday, January 31, 2005 - link
The point of this articles wasn't to give everyone a specific decision. Some people are always waiting for the ideal time to upgrade. If you're happy with your current computer, then by no means do you need to upgrade. If you're disappointed with performance, however, and you start thinking something like, "I'll wait for SLI..." or "X800XL is coming soon..." or soemthing similar, is it really worth the wait?That's the whole point behind the "cost to not upgrade". How much are you willing to spend per day for a better computing experience? We arbitratily chose 25 cents, but suppose you're willing to spend 50 cents or a dollar? Given the model in the spreadsheets, you can plug in various prices and estimated depreciatioin rates, and suddenly it may not look so important to wait for the X800XL or whatever.
The article certainly wasn't meant as a joke. It was intended as some reasoning behind our price guides. We don't often suggest people wait for the Next Big Thing, and the models presented here help to show why. We didn't even touch on the topic of market segmentation, which will often keep high-end parts at a higher price despite decreased production costs (witness SCSI, for example). There were plenty of other concepts that could also be applied. Hope that helps.
(I helped quite a bit with the article, so I feel I can safely put in my two cents.)
roostercrows - Monday, January 31, 2005 - link
Poser - Monday, January 31, 2005 - link
Thinking about it a bit more, I guess my situation (#19) could be wedged into the model you built pretty easily -- I don't have a Cost to Not Upgrade (CNU) of $0.25 a day, instead I have a NEGATIVE CNU. The longer I wait, the more cool gotta have 'em games will be released which I can't play on my old rig. That'll push up the value of current gen hardware.Chuckles - Sunday, January 30, 2005 - link
It looks like an interesting model. With some tweaking it looks like it may be valid for a variety of market segments. Cool.