The Intel Comet Lake Core i9-10900K, i7-10700K, i5-10600K CPU Review: Skylake We Go Again
by Dr. Ian Cutress on May 20, 2020 9:00 AM EST- Posted in
- CPUs
- Intel
- Skylake
- 14nm
- Z490
- 10th Gen Core
- Comet Lake
Our Office and Science Test section focuses significantly on real-world testing, user experience, with a slight nod to throughput. In this section we cover application loading time, image processing, simple scientific physics, artificial intelligence, and AVX accelerated code.
All of our benchmark results can also be found in our benchmark engine, Bench.
Office Tests
Application Load: GIMP 2.10.4
One of the most important aspects about user experience and workflow is how fast does a system respond. A good test of this is to see how long it takes for an application to load. Most applications these days, when on an SSD, load fairly instantly, however some office tools require asset pre-loading before being available. Most operating systems employ caching as well, so when certain software is loaded repeatedly (web browser, office tools), then can be initialized much quicker.
In our last suite, we tested how long it took to load a large PDF in Adobe Acrobat. Unfortunately this test was a nightmare to program for, and didn’t transfer over to Win10 RS3 easily. In the meantime we discovered an application that can automate this test, and we put it up against GIMP, a popular free open-source online photo editing tool, and the major alternative to Adobe Photoshop. We set it to load a large 50MB design template, and perform the load 10 times with 10 seconds in-between each. Due to caching, the first 3-5 results are often slower than the rest, and time to cache can be inconsistent, we take the average of the last five results to show CPU processing on cached loading.
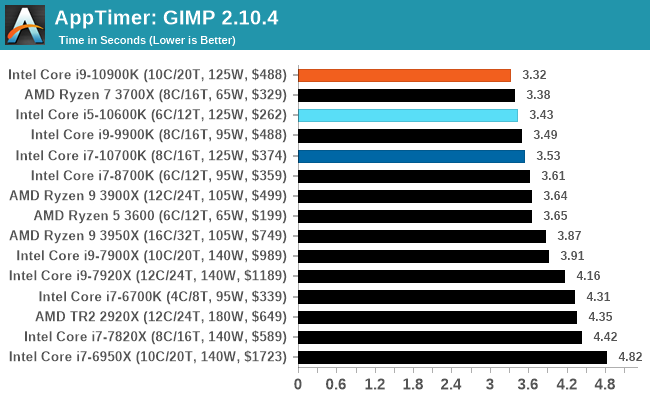
GIMP likes fast single core performance, and so the Core i9 wins here.
Agisoft Photoscan 1.3.3: 2D Image to 3D Model Conversion
One of the ISVs that we have worked with for a number of years is Agisoft, who develop software called PhotoScan that transforms a number of 2D images into a 3D model. This is an important tool in model development and archiving, and relies on a number of single threaded and multi-threaded algorithms to go from one side of the computation to the other.

In our test, we take v1.3.3 of the software with a good sized data set of 84 x 18 megapixel photos and push it through a reasonably fast variant of the algorithms, but is still more stringent than our 2017 test. We report the total time to complete the process.
Agisoft’s Photoscan website can be found here: http://www.agisoft.com/
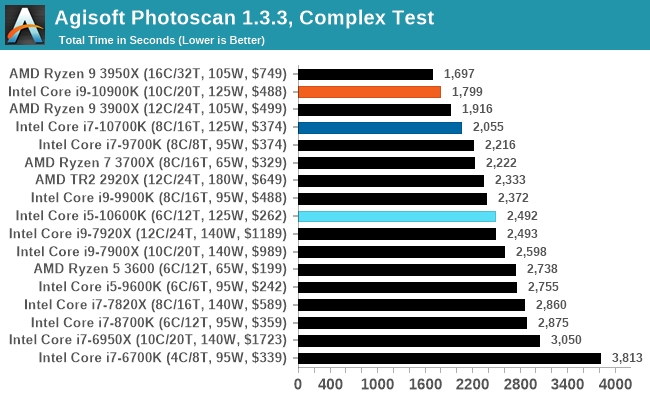
Agisoft is a mix of variable threaded workloads, so a good balanced system works best. Intel's $500 option is faster than AMD's $500 option here, with two fewer cores.
AI Benchmark
One of the longest time requests we’ve had for our benchmark suite is AI-related benchmark, and the folks over at ETH have moved their popular AI Benchmark from mobile over PC. Using Intel’s MKL and Tensorflow 2.1.0, we use version 0.1.2 of the benchmark which tests both training and inference over a variety of different models. You can read the full scope of the benchmark here.
This is one of our new tests in the database, and we are still gaining data for it.
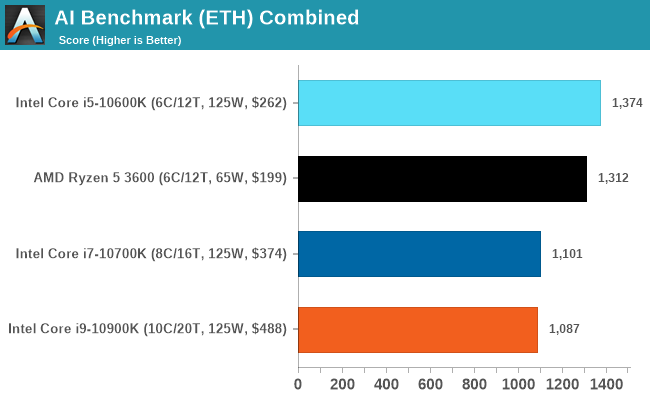
AIBench is a new test here, covering both training and inference. In the breakdown of results, we noticed that the faster processors were actually slower, scoring a lower result. We believe this is down to the lower bandwidth/core afforded by the 10c design against the 6c design.
Accelerated Science Tests
3D Particle Movement v2.1: Brownian Motion
Our 3DPM test is a custom built benchmark designed to simulate six different particle movement algorithms of points in a 3D space. The algorithms were developed as part of my PhD., and while ultimately perform best on a GPU, provide a good idea on how instruction streams are interpreted by different microarchitectures.
A key part of the algorithms is the random number generation – we use relatively fast generation which ends up implementing dependency chains in the code. The upgrade over the naïve first version of this code solved for false sharing in the caches, a major bottleneck. We are also looking at AVX2 and AVX512 versions of this benchmark for future reviews.
For this test, we run a stock particle set over the six algorithms for 20 seconds apiece, with 10 second pauses, and report the total rate of particle movement, in millions of operations (movements) per second. We have a non-AVX version and an AVX version, with the latter implementing AVX512 and AVX2 where possible.
3DPM v2.1 can be downloaded from our server: 3DPMv2.1.rar (13.0 MB)
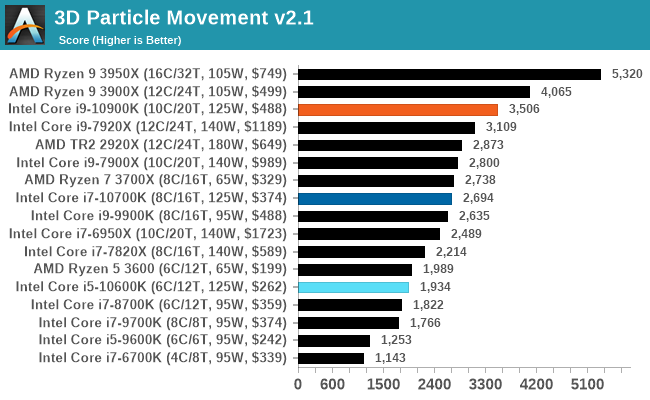
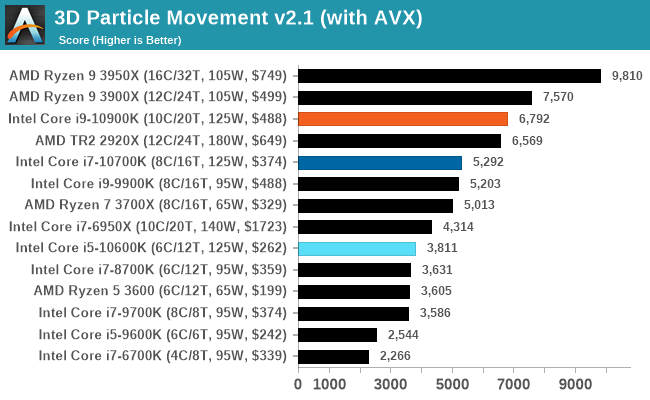
No real surprises in our 3DPM tests.
y-Cruncher v0.7.6: Microarchitecture Optimized Compute
I’ve known about y-Cruncher for a while, as a tool to help compute various mathematical constants, but it wasn’t until I began talking with its developer, Alex Yee, a researcher from NWU and now software optimization developer, that I realized that he has optimized the software like crazy to get the best performance. Naturally, any simulation that can take 20+ days can benefit from a 1% performance increase! Alex started y-cruncher as a high-school project, but it is now at a state where Alex is keeping it up to date to take advantage of the latest instruction sets before they are even made available in hardware.
For our test we run y-cruncher v0.7.6 through all the different optimized variants of the binary, single threaded and multi-threaded, including the AVX-512 optimized binaries. The test is to calculate 250m digits of Pi, and we use the single threaded and multi-threaded versions of this test.
Users can download y-cruncher from Alex’s website: http://www.numberworld.org/y-cruncher/
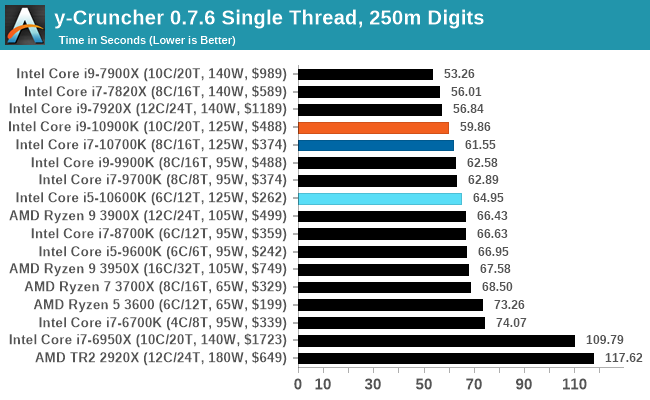
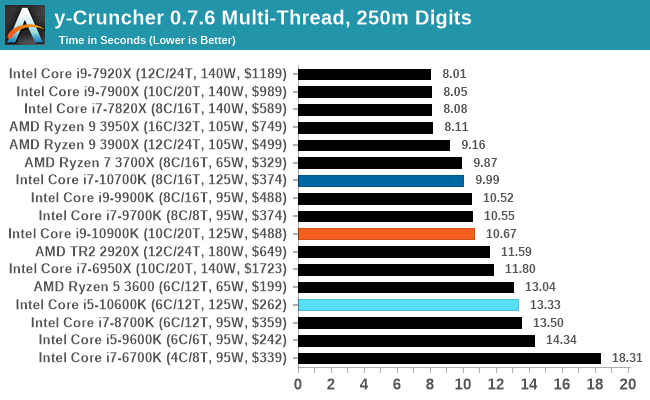
y-Cruncher is another one where the Core i9 performs worse than the Core i7 in the multithreaded test, despite being better on the single threaded test. We again put this down to memory bandwidth. We need to update this test to the latest version of y-Cruncher, which has additional optimizations for Zen 2 processors, but also to increase the digit count in our MT test.


220 Comments
View All Comments
catavalon21 - Wednesday, May 20, 2020 - link
+1Lord of the Bored - Friday, May 22, 2020 - link
The nostalgia is strong these days.Bidz - Wednesday, May 20, 2020 - link
So... where is the temperature chart? Given the power usage and the tier level of the product I would say many users want to know how practical it is to use.LawRecords - Wednesday, May 20, 2020 - link
Agreed. Its odd that thermals are missing given the high power draw.shabby - Wednesday, May 20, 2020 - link
I'd imagine it would be pegged at 90c since the cpu is constantly clocking itself as high as it can.DannyH246 - Wednesday, May 20, 2020 - link
Its not odd at at all. Its to make Intel look better we all know this.shady28 - Wednesday, May 20, 2020 - link
LTT has a video on thermals. The thermals for the gen 10 are better than gen 9, despite the higher clocks and core counts. Intel redesigned the conductive layer between the die and the lid. It worked.Spunjji - Tuesday, May 26, 2020 - link
Seriously? The thermals are better despite the higher power draw?I'm guessing this is a case of being able to get the heat out more easily *if you have a cooling system capable of subsequently dealing with the heat being pulled out*. That would make sense given the changes involved, but it involves the assumption that people are prepared to go from 280mm+ radiators.
mrvco - Wednesday, May 20, 2020 - link
I get that this is a CPU review and not a GPU or system review, but it would be helpful to also include gaming resolutions w/ quality settings that people actually use for gaming rather just benchmarking... especially when building a gaming system and making decisions on how to allocate budget between CPU (+p/s +cooling) and GPU.TheUnhandledException - Wednesday, May 20, 2020 - link
I agree. Yes the result will show nearly identical performance from a 10900 down to an Ryzen 3600 but that is kinda the point. You don't really need an ultra high end CPU for gaming at high resolution. Even if it was just one game it would be nice to see how CPU performance scales at 1080p, 1080p high quality, 1440p, and 4K.