The Intel Comet Lake Core i9-10900K, i7-10700K, i5-10600K CPU Review: Skylake We Go Again
by Dr. Ian Cutress on May 20, 2020 9:00 AM EST- Posted in
- CPUs
- Intel
- Skylake
- 14nm
- Z490
- 10th Gen Core
- Comet Lake
CPU Performance: Web and Legacy Tests
While more the focus of low-end and small form factor systems, web-based benchmarks are notoriously difficult to standardize. Modern web browsers are frequently updated, with no recourse to disable those updates, and as such there is difficulty in keeping a common platform. The fast paced nature of browser development means that version numbers (and performance) can change from week to week. Despite this, web tests are often a good measure of user experience: a lot of what most office work is today revolves around web applications, particularly email and office apps, but also interfaces and development environments. Our web tests include some of the industry standard tests, as well as a few popular but older tests.
We have also included our legacy benchmarks in this section, representing a stack of older code for popular benchmarks.
All of our benchmark results can also be found in our benchmark engine, Bench.
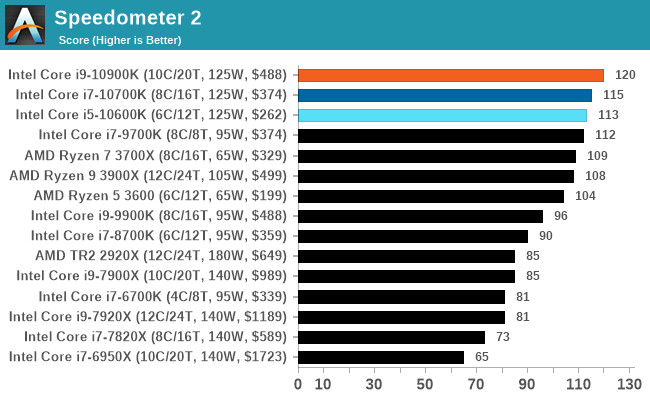
Speedometer 2: JavaScript Frameworks
Our newest web test is Speedometer 2, which is a accrued test over a series of javascript frameworks to do three simple things: built a list, enable each item in the list, and remove the list. All the frameworks implement the same visual cues, but obviously apply them from different coding angles.
Our test goes through the list of frameworks, and produces a final score indicative of ‘rpm’, one of the benchmarks internal metrics. We report this final score.
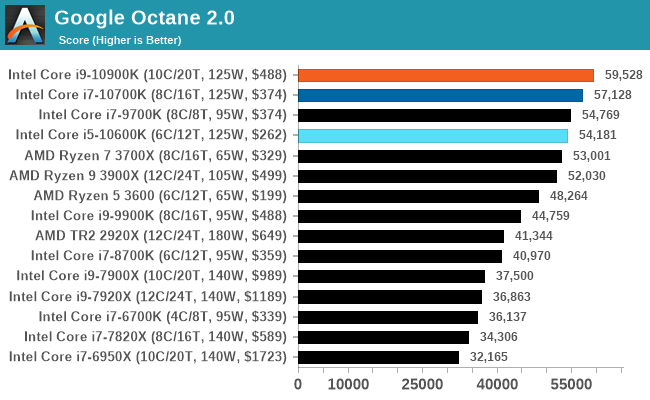
Google Octane 2.0: Core Web Compute
A popular web test for several years, but now no longer being updated, is Octane, developed by Google. Version 2.0 of the test performs the best part of two-dozen compute related tasks, such as regular expressions, cryptography, ray tracing, emulation, and Navier-Stokes physics calculations.
The test gives each sub-test a score and produces a geometric mean of the set as a final result. We run the full benchmark four times, and average the final results.
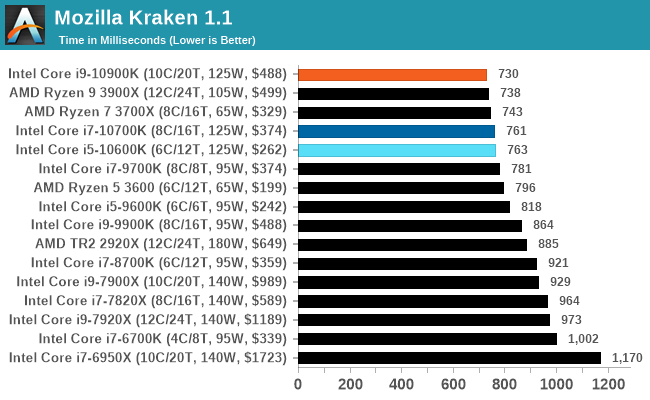
Mozilla Kraken 1.1: Core Web Compute
Even older than Octane is Kraken, this time developed by Mozilla. This is an older test that does similar computational mechanics, such as audio processing or image filtering. Kraken seems to produce a highly variable result depending on the browser version, as it is a test that is keenly optimized for.
The main benchmark runs through each of the sub-tests ten times and produces an average time to completion for each loop, given in milliseconds. We run the full benchmark four times and take an average of the time taken.
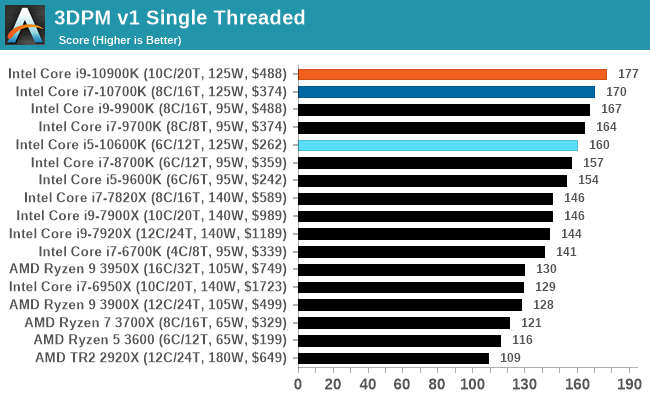
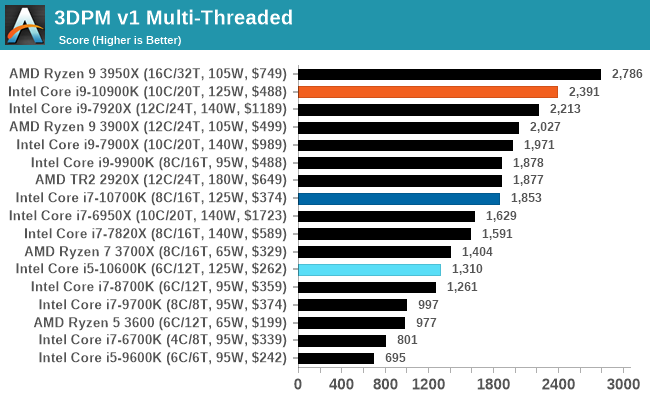
3DPM v1: Naïve Code Variant of 3DPM v2.1
The first legacy test in the suite is the first version of our 3DPM benchmark. This is the ultimate naïve version of the code, as if it was written by scientist with no knowledge of how computer hardware, compilers, or optimization works (which in fact, it was at the start). This represents a large body of scientific simulation out in the wild, where getting the answer is more important than it being fast (getting a result in 4 days is acceptable if it’s correct, rather than sending someone away for a year to learn to code and getting the result in 5 minutes).
In this version, the only real optimization was in the compiler flags (-O2, -fp:fast), compiling it in release mode, and enabling OpenMP in the main compute loops. The loops were not configured for function size, and one of the key slowdowns is false sharing in the cache. It also has long dependency chains based on the random number generation, which leads to relatively poor performance on specific compute microarchitectures.
3DPM v1 can be downloaded with our 3DPM v2 code here: 3DPMv2.1.rar (13.0 MB)
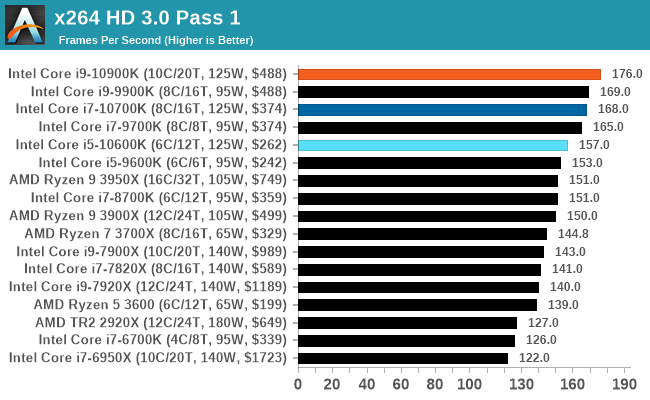
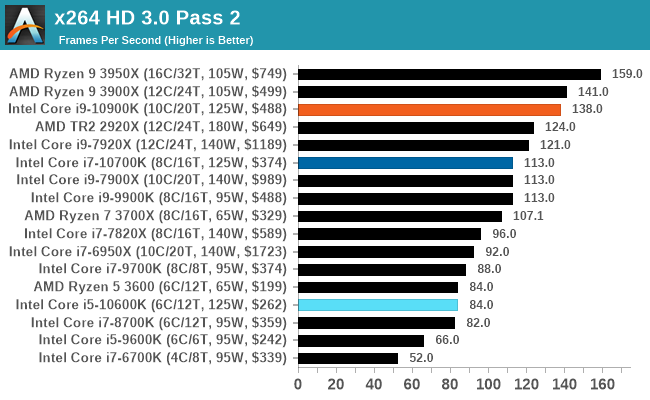
x264 HD 3.0: Older Transcode Test
This transcoding test is super old, and was used by Anand back in the day of Pentium 4 and Athlon II processors. Here a standardized 720p video is transcoded with a two-pass conversion, with the benchmark showing the frames-per-second of each pass. This benchmark is single-threaded, and between some micro-architectures we seem to actually hit an instructions-per-clock wall.


220 Comments
View All Comments
ByteMag - Wednesday, May 20, 2020 - link
I'm wondering why the 3300X wasn't in the DigiCortex benchmark? This $120 dollar 4c/8t banger lays waste to the selected lineup. Or is it too much of a foreshadowing of how Zen 3 may perform? I guess benchmarks can sometimes be like a box of chocolates.ozzuneoj86 - Wednesday, May 20, 2020 - link
Just a request, but can you guys consider renaming the "IGP" quality level something different? The site has been doing it for a while and it kind of seems like they may not even know why at this point. Just change it to "Lowest" or something. Listing "IGP" as a test, when running a 2080 Ti on a CPU that doesn't have integrated graphics is extremely confusing to readers, to say the least.Also, I know the main reason for not changing testing methods is so that comparisons can be done (and charts can be made) without having to test all of the other hardware configs, but I have one small request for the next suite of tests (I'm sure they'll be revised soon). I'd request that testing levels for CPU benchmarks should be:
Low Settings at 720P
Max Settings at 1080P
Max Settings at 1440P
Max Settings at 4K
(Maybe a High Settings at 1080P thrown in for games where the CPU load is greatly affected by graphics settings)
Drop 8K testing unless we're dealing with flagship GPU releases. It just seems like 8K has very little bearing on what people are realistically going to need to know. A benchmark that shows a range from 6fps for the slowest to 9fps for the fastest is completely pointless, especially for CPU testing. In the future, replacing that with a more common or more requested resolution would surely be more useful to your readers.
Often times the visual settings in games do have a significant impact on CPU load, so tying the graphical settings to the resolution for each benchmark really muddies the waters. Why not just assume worst case scenario performance (max settings) for each resolution and go from there? Obviously anti-aliasing would need to be selected based on the game and resolution, with the focus being on higher frame rates (maybe no or low AA) for faster paced games and higher fidelity for slower paced games.
Just my 2 cents. I greatly appreciate the work you guys do and it's nice to see a tech site that is still doing written reviews rather than forcing people to spend half an hour watching a video. Yeah, I'm old school.
Spunjji - Tuesday, May 26, 2020 - link
Agreed 99% with this (especially that last part, all hial the written review) - but I'd personally say it makes more sense for the CPU reviews to be limited to 720p Low, 1080P High and 1440P Max.My theory behind that:
720p Low gives you that entirely academic CPU-limited comparison that some people still seem to love. I don't get it, but w/e.
1080p High is the kind of setting people with high-refresh-rate monitors are likely to run - having things look good, but not burning frames for near-invisible changes. CPU limiting is likely to be in play at higher frame rates. We can see whether a given CPU will get you all the way to your refresh-rate limit..
1440p Max *should* take you to GPU-limited territory. Any setting above this ought to be equally limited, so that should cover you for everything, and if a given CPU and/or game doesn't behave that way then it's a point of interest.
dickeywang - Wednesday, May 20, 2020 - link
With more and more cores being added to the CPU, it would've been nice to see some benchmarks under Linux.MDD1963 - Wednesday, May 20, 2020 - link
Darn near a full 2% gain in FPS in some games! Quite ...uhhh..... impressive! :/MDD1963 - Wednesday, May 20, 2020 - link
Doing these CPU gaming comparisons at 720P is just as silly as when HardOCP used to include 640x480 CPU scaling...; 1080P is low enough, go medium details if needed.Spunjji - Tuesday, May 26, 2020 - link
Personally agreed here. It just gives more fodder to the "15% advantage in gaming" trolls.croc - Wednesday, May 20, 2020 - link
It would be 'nice' if the author could use results from the exact same stack of chips for each test. If the same results cannot be obtained from the same stack, then whittle the stack down to those chips for which the full set of tests can be obtained. I could understand the lack of results on newly added tests...For a peer review exercise it would be imperative, and here at Anandtech I am sure that there are many peers....
69369369 - Thursday, May 21, 2020 - link
Overheating and very high power bills happens with Intel.Atom2 - Thursday, May 21, 2020 - link
Dear Ian, You must be the only person on the planet that goes to such lengths not to use AVX, that you even compare Intel's AVX512 instructions to a GPU based OpenCL, just to have a reason not to use it. Consequently you only have AMD win the synthetic benchmarks, but all real world math is held by Intel. Additionally, all those synthetics, which are "not" compiled with Intel C++. Forget it... GCC is only used by Universities. The level of bias towards AMD is becoming surreal.