Western Digital's Raptors in RAID-0: Are two drives better than one?
by Anand Lal Shimpi on July 1, 2004 12:00 PM EST- Posted in
- Storage
SYSMark Performance Summary
The overall SYSMark scores summarize what we've seen thus far: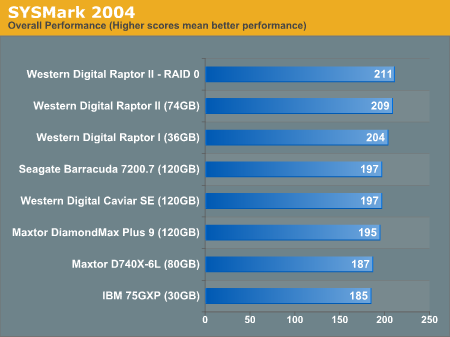
The overall SYSMark performance graph pretty much says it all - a slight, but completely unnoticeable, performance increase, thanks to RAID-0, is what buying a second drive will get you.
As a recap, here's what happens with the Internet Content Creation suite:
"In this scenario, the content creator creates a product-related website targeting a broadband and narrowband audience. The user first renders a 3D model to a bitmap, while preparing web pages using a web site publishing tool. The user opens a video editing package, creates a movie from several raw input movie cuts and sound cuts and starts exporting it. While waiting on this operation, the user imports the rendered image into an image-processing package, modifies it and saves the results. Back in the 3D modeling software, the user modifies a 3D model and exports it to a vector-graphics format. Once the movie is assembled, the user edits it and creates special effects using one of the modified images as input. The user extracts content from an archive. Meanwhile, he uses an animation creation tool to open the exported 3D vector graphics file. He modifies it by including other pictures and optimizes it for faster animation. The final movie with the special effects is then compressed in a format that can be broadcast over broadband Internet. The web site is given the final touches and the system is scanned for viruses."
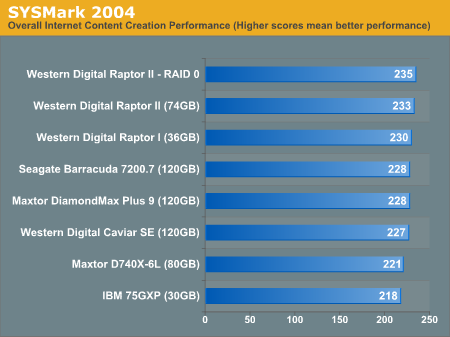
The trend continues with overall Internet Content Creation performance.
Also recapping, here's what happens in the entire Office Productivity suite:
"In this scenario, the office productivity user creates a marketing presentation and supporting documents for a new product. The user receives email containing a collection of documents in a compressed file. The user reviews his email and updates his calendar while a virus checking software scans the system. The corporate web site is viewed and the user begins creating the collateral documents. The user also accesses a database and runs some queries. A collection of documents are compressed. The queries' results are imported into a spreadsheet and used to generate graphical charts. The user then transcribes a document. Once the document has all the necessary pieces in place, the user changes it into a portable format for easy and secure distribution. The user edits and adds elements to a slide show template. Finally, the user looks at the results of his work (both the slide show and the portable document) in an Internet browser."
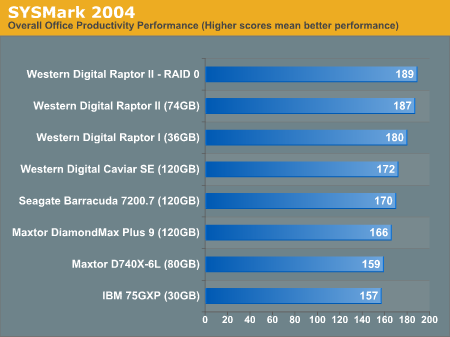
Even in our office productivity tests, we see that RAID-0 basically yields no performance improvement.


127 Comments
View All Comments
Arth1 - Thursday, July 1, 2004 - link
The article contains several factual errors.RAID 1, for example, does have *read* speed benefits over a single drive, as you can read one block from one drive and the next block from the other drive at the same time.
Also, what was the block size used, and what was the stripe size?
Was the block size doubled when striping (as is normally recommended to keep the read size identical)?
Since non-serial-ATA drives were part of the test, how come THEY were not tried in a RAID? That way we could have seen how much was the striping effect and how much was due to using two serial ATA ports.
All in all a very useless article, I'm afraid
qquizz - Thursday, July 1, 2004 - link
here, here, what about more ordinairy drives.Kishkumen - Thursday, July 1, 2004 - link
Regarding Intel Application Accelerator, I would like to know if that was installed or not as well. It seems to me that could potentially affect performance quite a bit. But perhaps it doesn't make a difference? Either way, I would like to know.pieta - Thursday, July 1, 2004 - link
It's funny to see metion of ATA and performance. If you really want disk performance, get some real SCSI drives. Without tag cmd queuing, RAID configurations aren't able to reach their full potential.It would be interesting see hadware sites measure SCSI performance. Sure, ATA has the price point, but with 15K SCSI spinners so cheap these days, the major cost is the investment in the HBA. With people dropping 500 bucks on a video card, why is it so inconvievable to think power users wouldn't want to run with the best I/O available?
I was suprised not to see any Iometer benchmarks. IOPS and response times are king in determining disk performance. Iometer is still the best tool, as you can configure workers match typical workloads.
Show me a review of the latest dual ported ultra320 hardware raid HBA stripped across four 15k spinners. Compare that with a 2 drive configuration and the SATA stuff. Show me IOPS, response times, and CPU utilization. That would be meaningful, as people could better justify the extra $2-300 cost going with a real I/O performer.
meccaboy858 - Thursday, July 1, 2004 - link
meccaboy858 - Thursday, July 1, 2004 - link
meccaboy858 - Thursday, July 1, 2004 - link
meccaboy858 - Thursday, July 1, 2004 - link
Nighteye2 - Thursday, July 1, 2004 - link
Of course, RAID 0 makes little sense for raptors, which are already so fast that they hardly form a bottleneck.RAID 0 makes more sense for slower, cheaper HD's...try 2 WD 80GB 8MB cache harddisks, for example. Together they are cheaper than a raptor, but I expect performance will be very similar, if not faster.
Taracta - Thursday, July 1, 2004 - link
I am tired of seeing these RAID 0 articles just throwing 2 disk together and getting results that are contrary to what is expected and not dig deeper into what's the problem. I am only posting my comment here because of my repect for this site. Drive technology and methodlogy has to play apart in discussion of RAID technology. The principle behind RAID 0 is sound. The throughput is a multiple of the number of drives in the array (You will not get 100% but close to it). Not getting this, it should be examined as to WHY? One of my suspicion is that incorrect setup of the array is the primary culprit. How is information written to/from the drive, the array and to individual drives in individual arrays. What is the cluster and sectors sizes. How is the information broken up by the controller to be written to the array. Take for example each drive in a array has a minimum data size of 64bits and you have array sizes of 2 rives 128bits, 3 drives 192bits and four drives 256bits. In initializing you array do you intialize for 64bits, 128bits, 192bits or 256bit? Does it matter? Say for example you initialize for 64bits, does the array controller writes 64bits to each drive or does it writes 64bits to the first drive and 0bits (null spaces and wasting and defeating the purpose of the extra drives) to the other drives because it is expecting the array size bits (eg 128bits for 2 drives)or does it split the 64bits between the drives and waste space and kill performance because each drive allocate a minimum of 64bits. I was waiting for someone to examine in detail what's happening. Xbitlabs came close (from looking at the charts)that they could almost taste it I am sure but still jump to incorrect reasoning.I know I am rambling but in short the premise of RAID arrays are sound so why is it not showing up in the results of the testing?