The Samsung Galaxy S9 and S9+ Review: Exynos and Snapdragon at 960fps
by Andrei Frumusanu on March 26, 2018 10:00 AM ESTCPU Battle - SPEC Performance & Efficiency
We move onto SPEC for synthetic performance of the CPU cores and analysis. The following results are not officially submitted scores and therefore we must put out the disclaimer that these are estimates. The compiler used is Clang/LLVM bundled with the NDRr16rc1 and we’re using the same build we ran in the Kirin 970 article earlier in January. This includes the simple compiler flags of –Ofast and –mcpu=Cortex-A53.
The metrics measured are the SPECspeed for each workload and platform depicted on the right axis growing from the right. Bigger values represent higher performance.
I made a slight change in representation of energy efficiency compared to the Kirin 970 article, instead of the arbitrary Perf/Energy metric of SPECspeed per total Joules, this time around I’m rather representing the total energy consumed for each workload. The workloads are fixed in their complexity and work done so this should better represent efficiency of a task done instead of the perf/W metric that is better suited to continuous workloads such as found in 3D games.
The left axis thus represents the total system active energy usage for the benchmarks. Alongside I also depicted the average power over the length of the benchmark run. The less energy a platform consumed, the better it is in efficiency and thus battery life. The average power metric is a secondary metric that in this case plays less importance, however still should be considered in the case of thermal envelope limitations.
The results are colour-coded in shades of different SoC manufacturers and are also sorted by newest generation to the oldest by each SoC vendor, in the order as listed in the legend.
Starting off we run the SPECint2006 suite which focuses most on integer workloads.

The first results are interesting and the first thing we notice – particularly in contrast to the last time we looked at SPEC – is that we now finally have SoCs which make a significant leap in performance from the tight grouping we’ve seen over the past few years.
The Exynos 9810 fares extremely well in execution and IPC-bound benchmarks such as 400.perlbench, 403.gcc, 456.hmmer, and 464.h264ref, where we see a 66 to 88% increase in performance. In mixed workload benchmarks the M3 cores also fare well but don’t quite show the improvement we had expected and seen in less memory intensive benchmarks in SPEC and GeekBench 4.
462.libquantum deserves a special mention because it’s one of the few workloads that even with active cooling the SoC wasn’t able to maintain its peak performance as average power sustained at 4.8W.
I also have to remind reader that the devices were actively cooled in a reduced temperature environment, this is because the whole benchmark run takes 2-3 hours and we’re trying to look at peak performance. Transactional workloads are nowhere near this long-running and thus active cooling is warranted.
The Snapdragon 845 and Kryo 385 Gold/Cortex-A75 cores also fare relatively well compared to their predecessors. The new chip is able to show an average 30% improvement over the Snapdragon 835, even though the new SoC is handicapped. The limitation and regression of the memory subsystem is clearly visible in the results of the 429.mcf and 471.omnetpp workloads which are the most memory latency sensible benchmarks of the integer suite. Here the S845 respectively doesn’t manage to show an improvement and even actually shows a performance regression over its predecessor.
ARM had promised that the A75 would bring increased performance at the same efficiency. Usually this means same performance/W but for SPEC also means the same total energy usage at peak performance. ARM’s claim couldn’t be more validated than in the results here as we see the Snapdragon 845 within spitting distance of the Snapdragon 835’s energy usage throughout most of the workloads, sometimes winning and sometimes losing. Overall the Snapdragon 845 actually does 6% better than the Snapdragon 835. Because the energy usage is roughly the same, it means that the increase in performance came with a linear increase in power, again something which we can see throughout the results. As long as power remains under the sustainable thermal envelope of a device, having a higher power usage shouldn’t be of issue for transactional CPU workloads which are the most commonly found scenarios.
The Exynos 9810 marks a stark contrast to the Snapdragon 845 as its energy usage isn’t nearly as good. In fact at peak performance we’re seeing an overall regression over last year’s Exynos 8895. We expected the M3 cores to use a lot of power at peak frequency, but had hoped at least more competitive efficiency. The fact that we’re actually seeing a regression in efficiency over the M2 is worrying as it means that the increased performance comes at a price which will be visible in battery life.
I had hoped the M3 cores would come in at 2.5-2.8W usage as that would have left a bit of thermal headroom for at least dual-core operation at the peak frequency, however Samsung pushed the TDP and frequencies further above that for single-core usage.
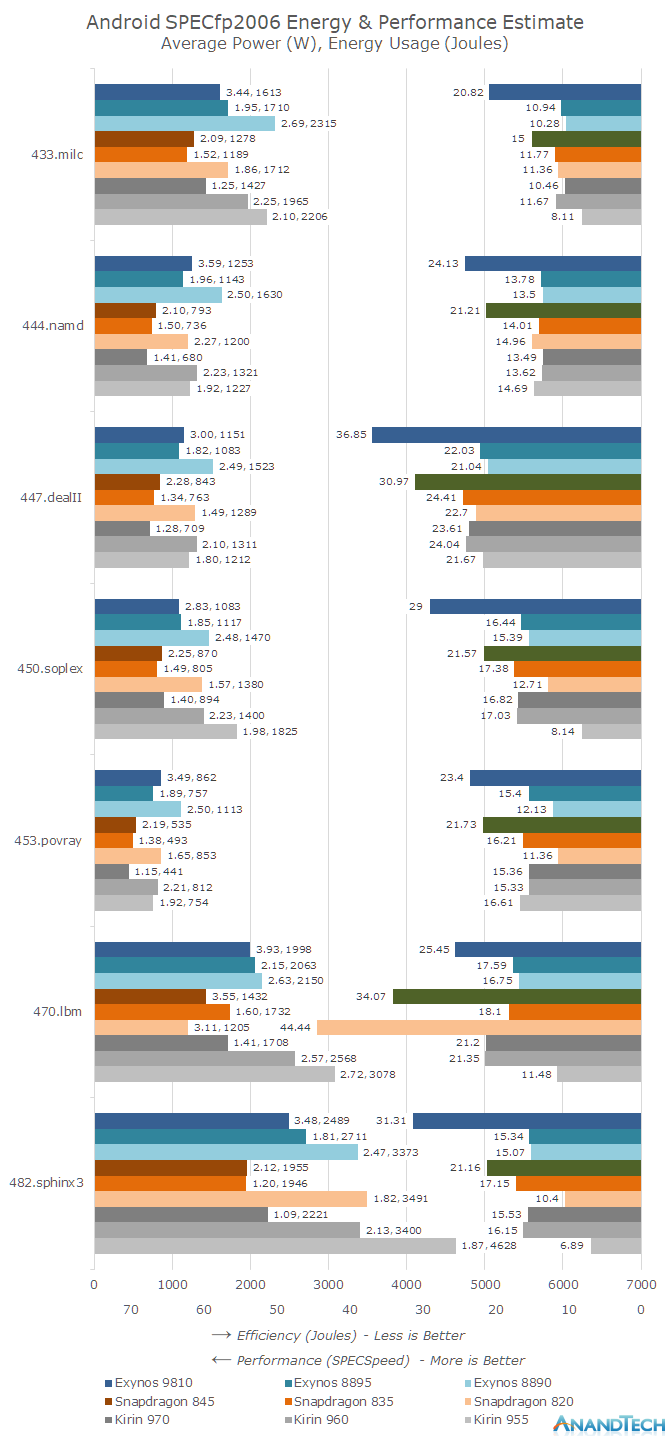
Moving on to SPECfp2006 we should see very large theoretical increases from both new SoCs as their respective new microarchitectures have significant changes in the floating point execution pipelines. The Exynos 9810 indeed manages to largely fulfil the expectations with up to nearly 2x increases in several benchmarks.
4 out of the 7 floating point benchmarks run here are very memory latency sensitive and that’s where the Snapdragon 845 posts the smallest gains over the Snapdragon 835. 470.lbm is the outlier here as we see outstanding gains for the S845 – oddly enough outpacing the E9810. The Snapdragon 820 and its Kryo cores still dominate this benchmark so it looks like the benchmark has a peculiar set of characteristics, one among them is having extremely large inner loops which might put stress on instruction window limitations of the cores.
The energy characteristics for the Snapdragon 845 are similar as those seen in the integer benchmarks: it matches the Snapdragon 835 and even lands within 0.5% of the latter total energy usage for the whole suite. Again, the power usage is higher at an average of 2.32W for the S845 vs 1.69W for the S835, but still within reasonable levels.
The Exynos 9810 again does not fare well as it’s only able to show a meagre efficiency improvement, even though the performance boost is 71% over the Exynos M2. Average power usage is at 3.78W, again this might not be that problematic as the most heavy floating point workloads is JavaScript usage when loading webpages, a task that is by definition bursty and transactional.
One thing to note as interesting is the difference in scaling on the Exynos 9810 and Snapdragon 845 between both integer and floating point average power. Samsung’s power only increases 8% for floating point while Qualcomm/ARM’s solution sees a larger 30% jump. I don’t know if this points out to more efficient floating point execution engines on Samsung’s part or if ARM has the more efficient integer core.
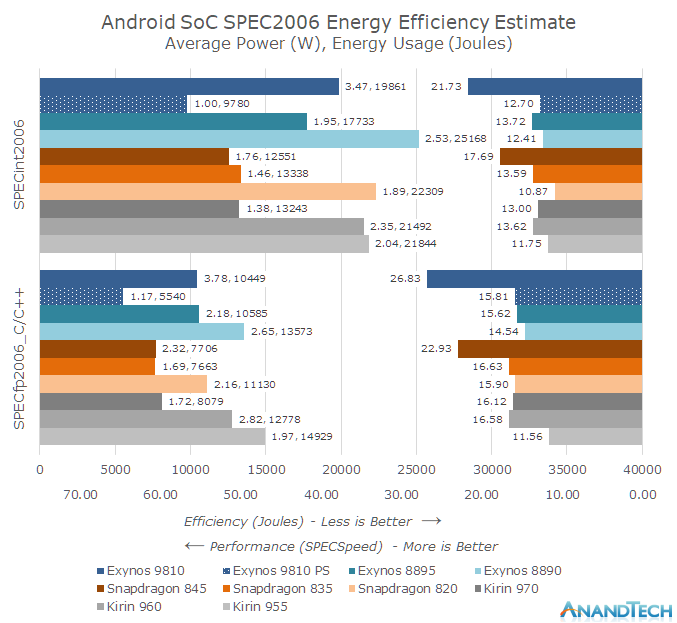
Moving on to the aggregate view of the SPEC suites we should have quite a lot more confidence in judging both new SoCs. The Samsung Exynos 9810 improves performance by 71% in integer and 69% in floating point workloads and respectively regresses by 12 or maintains the same energy usage as the Exynos 8895. The Snapdragon 845’s performance boost is smaller coming in at 30% for integer and 37% for floating point, and the S845 also is able to post this improvement while keeping energy usage stable.
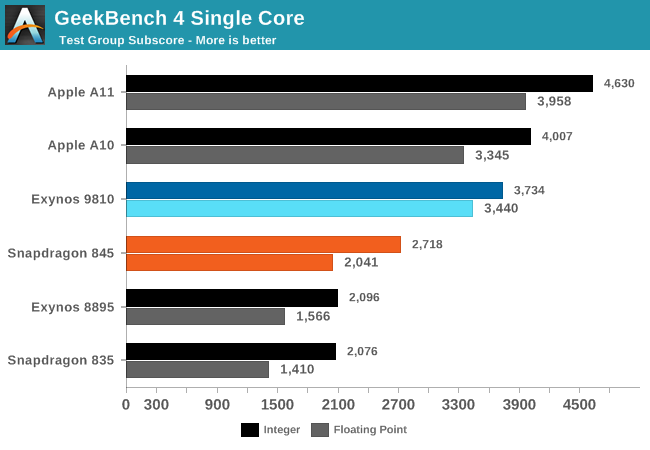
It’s when we try to compare the Exynos 9810 versus the Snapdragon 845 where we start to see issues when trying to reconcile the fact that the Galaxy S9 is powered by both SoCs. With its new microarchitecture and significant silicon budget, the Exynos 9810 only manages a 22% and 17% lead over the Snapdragon 845, a stark contrast to the much larger discrepancy that we had previously analysed in GeekBench 4 measured coming in at 37% and 68% for integer and floating point workloads. On top of that, the Exynos’ performance lead comes at a steep price of energy efficiency, as under SPEC the Samsung SoC had to use 62% and 35% more energy to complete the tests. Indeed this is something I had to practically experience, as the Exynos S9 required a partial battery recharge to be able to complete the SPEC suite, whereas the Snapdragon 845 managed within a battery charge.
This still didn’t actually answer the question of which SoC is actually the more efficient micro-architecturally. We know the Exynos 9810 loses at full performance, but that’s also mostly because S.LSI pushes the clock very high at cost of voltage and efficiency. The best comparison would be if one clocked down the Exynos to the Snapdragon 845’s performance and re-measure the efficiency. In the interests of finishing this review have opted to not yet modify the device and root it to gain full DVFS control, so that will have to come later. But what I could do is use Samsung’s battery saving mode. The “CPU limiter” included as an option in Samsung’s battery savings modes caps the frequency of the M3 cores to 1478MHz and also changes other things such as scheduler settings.
Coincidentally, running under this mode quite closely matches the posted performance of last generation’s SoCs, both in SPEC as well as GeekBench, which gives us a good iso-performance comparison to that generation. Here the Exynos 9810 fares extremely well as it’s 28% more efficient than the Snapdragon 835 and 45-48% more efficient than the Exynos 8895.
However it doesn't make much sense to compare it to last generation, as the competition right now is what matters. What we can do is a little extrapolation. Assuming a linear increase in energy with a linear increase in performance, how would the Exynos 9810 fare against the Snapdragon 845 if use used the CPU limited data-points as a lower base-line? Unfortunately it doesn’t look good as even with linear scaling, the Exynos 9810 would use up more energy than the Snapdragon 845 at peak performance with a deficit of 8% and 4%. In reality this deficit would be larger as the increased performance doesn’t come with a linear energy increase but rather an exponential one. So at least at first view, the Exynos 9810 looks less efficient than the Snapdragon 845 across the board, and seemingly mathematically impossible to match.
In a vacuum, the Exynos 9810 could be seen as a good improvement over the Exynos 8895. However Samsung LSI isn’t only competing against itself and iterating on its products, it needs to compete against ARM’s ever-evolving offers as well. Unfortunately it feels like S.LSI keeps being one generation behind when it comes to efficiency – the A72 beating the M1, the A73 beating the M2 and now the A75 beating the M3. If you were to shift the microarchitectures one year ahead in Samsung’s favour then suddenly we would have had a much better competitive situation. What needs to happen with the M4 is a much larger efficiency boost to remain competitive with ARM’s upcoming designs and actually warrant the use of an internal CPU design team. Currently a 17-22% performance lead does not seem worth a 35-58% efficiency disadvantage along with the 2x higher silicon area cost.
The big question remaining is how the synthetic performance translates into real-world performance and battery life.


190 Comments
View All Comments
jospoortvliet - Monday, March 26, 2018 - link
Thou did an amazing job explaining/analysing why the Exynos performs so bad in practice for a SOC with such powerful cores. THANK YOU for that as it has been missing from every other test, leaving readers speculating. I hope SAMSUNG can address these problems and shame on them for releasing a devise with such a bad tuning! Makes them look bad and incompetent, honestly, their software/kernel team needs a real kick in the but for making the CPU design team look so bad! Perhaps indeed the M3 hasn't caught up to the efficiency of Qualcomm but the (relatively) horrible performance in tests is certainly not due to bad SOC design...tvdang7 - Monday, March 26, 2018 - link
LTE battery test?SirCanealot - Tuesday, March 27, 2018 - link
No idea if this is current information, but Andrei has started in the past that he has really spotty reception where he is based; so I believe it is difficult for him to test battery life for cellular connections. Please correct me if I am wrong :)Andrei Frumusanu - Wednesday, March 28, 2018 - link
We've learned a lot about cellular testing and the sheer amount of variables that aren't controllable are crazy. For one I found out the carrier that I was on didn't have CDRX enabled on its base stations which worsened power usage by up to 30% on the handset. Since then I have a different carrier and better signal, but there's still questions about how representative the results are.For this review I didn't have time to test all devices since I have to do it sequentially while for Wi-Fi testing I can have all devices running at the same time.
robertkoa - Monday, July 9, 2018 - link
Yes. On my recently acquired [ 2 weeks ] I get very long Screen On Times [Qualcomm USAversion] in large part I assume to :ALWAYS have 2 to 5 bars of 4GLTE Signal from Metro PCS/ TMobile Towers- with 4 and 5 Bars inside large Malls (!). [ Phone NEVER changes Bands on Display ].
■Also - indoors I like low screen brightness. 30%
■I have very few APPS that are allowed to send Notifications.
■No SITES can send Notifications.
■All/ Most Options are OFF or asleep till I need them - Location/Sync/ Wifi/ etc etc etc
■ I use the Battery Maintenance "OPTIMIZE" a few times a day - there is no downside - Apps it puts to sleep come right back.
■ Apps don't choose to turn on things or use Battery as much as I can stop them ...lol.
First Nonremovable Battery Device....so a little overvigilant right now.
INCLUDING: not sure IF I will dowload HUGE 750 meg Update File of 'security updates' - I feel it might include constant background running processes and a larger Operating System and cost me battery life.
I can browse on 4G LTE 8 to 10 hours with 8 to 10 hours SOT now.
With an hour of calls and 45 minutes Youtube included ...7 to 8 hours SOT.
pjcamp - Monday, March 26, 2018 - link
Does it have a UI? Because I see no evidence of that in the index to this review. I haven't owned a Samsung since the S3 -- in Touchwiz still a shi77y thing?babadivad - Friday, April 13, 2018 - link
"Does it have a UI??"You could't interact with it at all if it didn't have a UI.
tipoo - Monday, March 26, 2018 - link
A little interesting that the four 'big' cores are smaller than the four 'little' cores, such that they would have used less die space with 8 of the gold. But I assume that's because more transistors were spent making X performance level more efficient.tipoo - Monday, March 26, 2018 - link
Also interesting how much we're still learning anew about the iPhone X display and how much Apple thought of that we still hadn't puzzled out, that the processing is very different than Samsungs despite being made by them.id4andrei - Monday, March 26, 2018 - link
Samsung "cobbled" color profiles to Android in an effort to provide some color management. Ios is still the only mobile os with a proper color management system. Until Google does the same, ios will be better, even if the iphone has lcd.