The Skylake Core i3 (51W) CPU Review: i3-6320, i3-6300 and i3-6100 Tested
by Ian Cutress on August 8, 2016 9:00 AM ESTLegacy Benchmarks
Some of our legacy benchmarks have followed AnandTech for over a decade, showing how performance changes when the code bases stay the same in that period. Some of this software is still in common use today.
All of our benchmark results can also be found in our benchmark engine, Bench.
3D Particle Movement v1
3DPM is a self-penned benchmark, taking basic 3D movement algorithms used in Brownian Motion simulations and testing them for speed. High floating point performance, MHz and IPC wins in the single thread version, whereas the multithread version has to handle the threads and loves more cores. This is the original version, written in the style of a typical non-computer science student coding up an algorithm for their theoretical problem, and comes without any non-obvious optimizations not already performed by the compiler, such as false sharing.
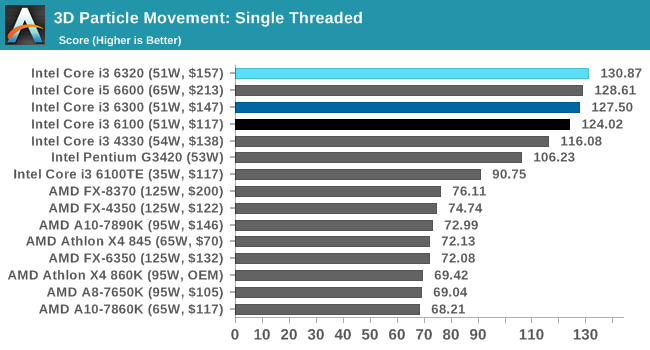
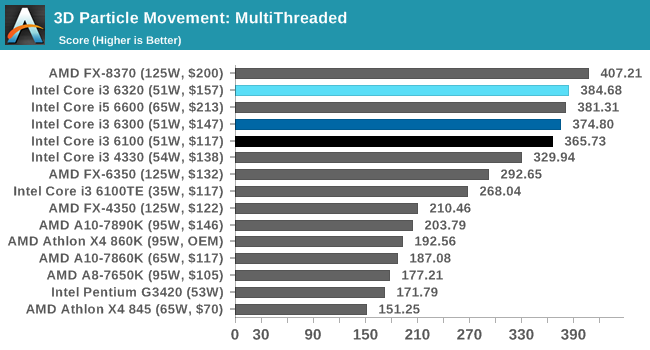
With un-trained programming skills comes a myriad of results. 3DPMv1 is not cache bound, but highly affected by false sharing and IPC. Our Core i3 staircase is in effect, and AMD is badly affected requiring 8 threads to match/beat an i3. In our v2 results, the spread is a more believable, which goes to show that having the right programming paradigm (even just a couple of lines of code) can make a large difference.
CineBench 11.5 and 10
Cinebench is a widely known benchmarking tool for measuring performance relative to MAXON's animation software Cinema 4D. Cinebench has been optimized over a decade and focuses on purely CPU horsepower, meaning if there is a discrepancy in pure throughput characteristics, Cinebench is likely to show that discrepancy. Arguably other software doesn't make use of all the tools available, so the real world relevance might purely be academic, but given our large database of data for Cinebench it seems difficult to ignore a small five minute test. We run the modern version 15 in this test, as well as the older 11.5 and 10 due to our back data.
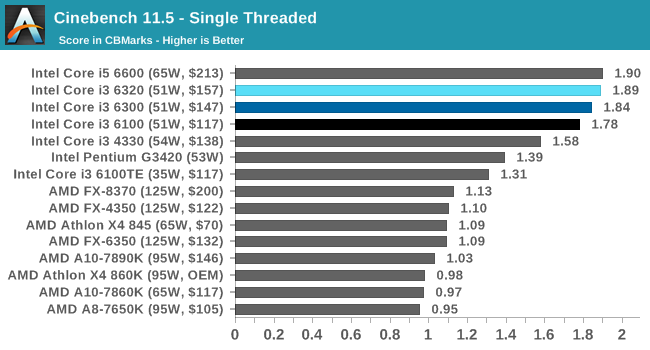
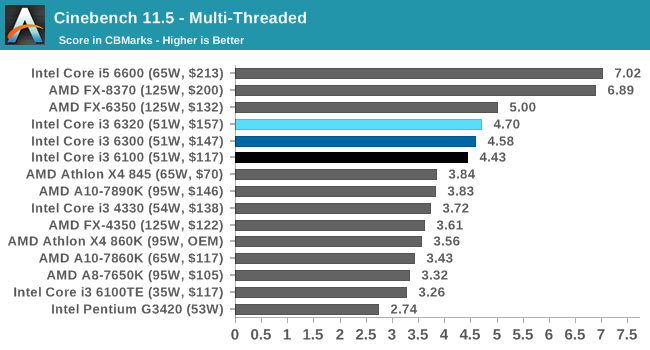
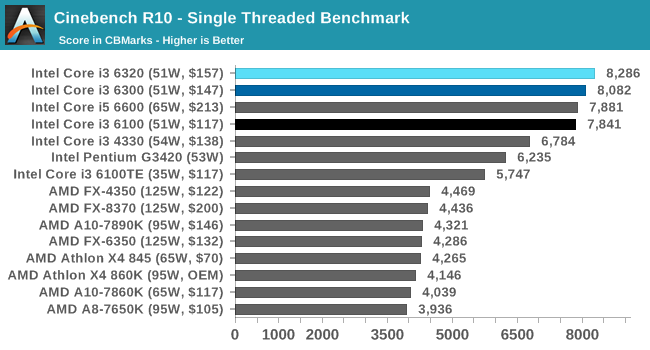
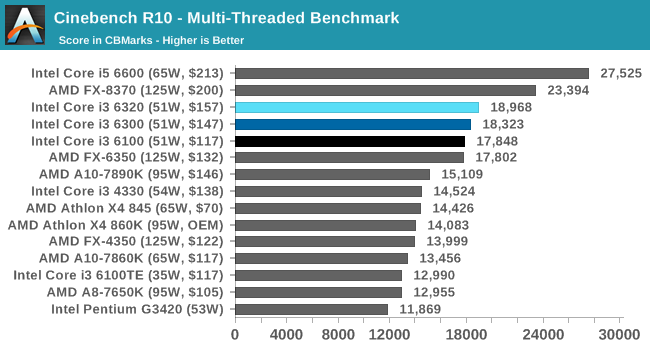
The older CB results mirror the CB15 test, albeit more compressed.
POV-Ray 3.7
POV-Ray is a common ray-tracing tool used to generate realistic looking scenes. We've used POV-Ray in its various guises over the years as a good benchmark for performance, as well as a tool on the march to ray-tracing limited immersive environments. We use the built-in multithreaded benchmark.
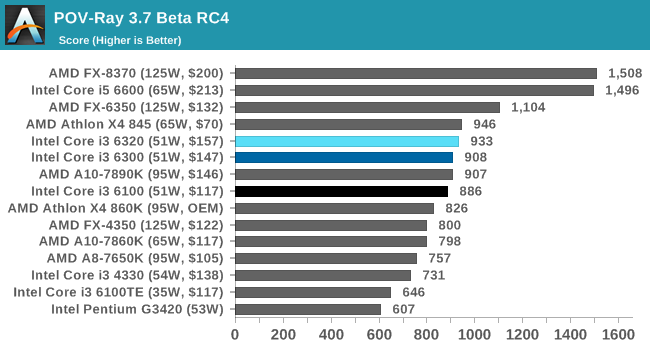
AMD gets a better showing in POV-Ray, with the $70 X4 845 going ahead of all of our Core i3 parts, and the older A10 sitting in between them. The older FX parts, despite their age, take advantage of the multi-threaded nature of the benchmark.
TrueCrypt 7.1
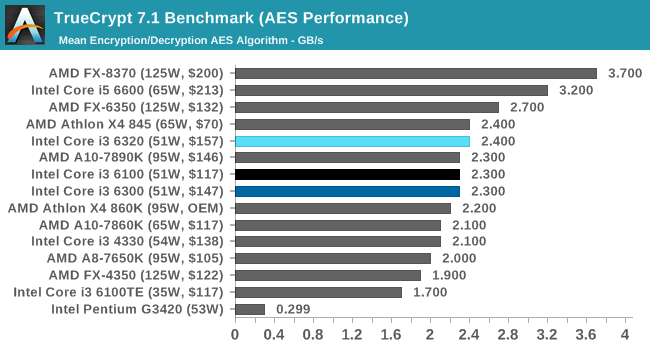
Before its discontinuation, TrueCrypt was a popular tool for WindowsXP to offer software encryption to a file system. The almost latest version, 7.1, is still widely used however the developers have stopped supporting it since the introduction of encrypted disk support in Windows 8/7/Vista from 5/2014, and as such any new security issues are unfixed.
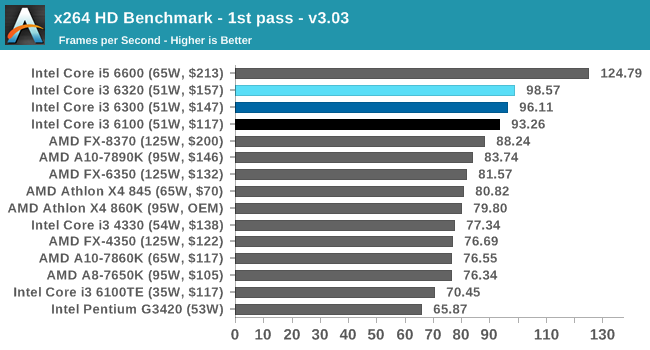
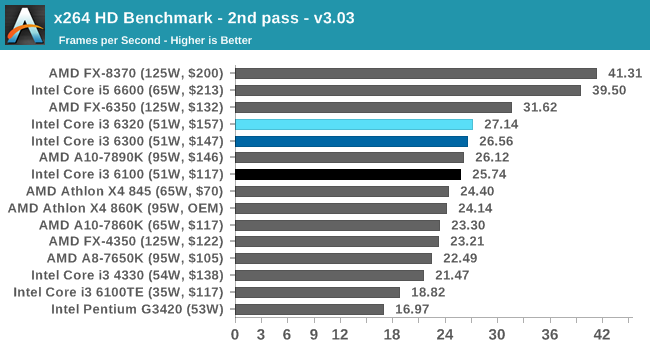
x264 HD 3.0
Similarly, the x264 HD 3.0 package we use here is also kept for historic regressional data. The latest version is 5.0.1, and encodes a 1080p video clip into a high quality x264 file. Version 3.0 only performs the same test on a 720p file, and in most circumstances the software performance hits its limit on high end processors, but still works well for mainstream and low-end. Also, this version only takes a few minutes, whereas the latest can take over 90 minutes to run.
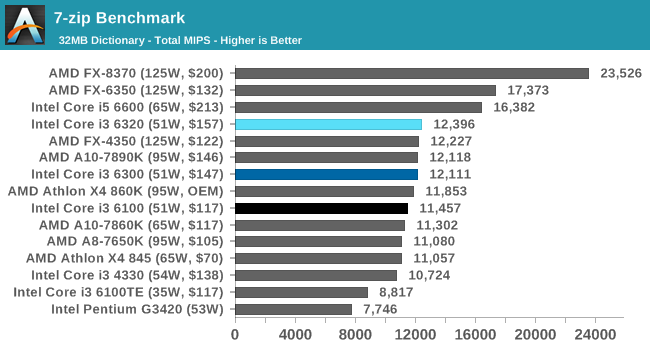
7-zip
7-Zip is a freeware compression/decompression tool that is widely deployed across the world. We run the included benchmark tool using a 50MB library and take the average of a set of fixed-time results.


94 Comments
View All Comments
Andr3w - Friday, September 16, 2016 - link
Hello guys ! I currently own a 860k OC at 4.2 Ghz paired with a Sapphire R7 370 2gb . After consulting this review I understand that the i3-6100 paired with the same R7 370 will perform better in gaming ? Correct me if I am wrong !Note : Currently I think, the 860k bottlenecks my R7 370 in Tom Clancy The Division. I am sayng this becasue the readings from MSI Afterburner show the following stats at medium settings, 1920x1080 resolution, V-Sync off :
GPU Usage 65 - 70 % with 1800 VRAM usage
CPU Usage on all 4 cores : 98 - 100 %
On the other hand in Star Wars Battlefront, on high settings, 1920x1080 resolution, V-Sync off, I've read the following stats :
GPU Usage : 100 % with about 1700 VRAM usage
CPU Usage : 65-70 % on all 4 cores.
So will it worth changing to i3-6100 ?
KosOR - Tuesday, October 30, 2018 - link
Recently, I had an opportunity to purchase cheaper new Haswell or Skylake motherboard together with cheaper second hand i3 processor. And I searched and found this article comparing i3-6100 and i3-4330 processors. I also compared both CPUs at PassMark and UserBenchmark results (cpubenchmark.net, userbenchmark.com). The cumulative performance difference there was not greater than 15%. The 15% number seems also compatible with CPU architecture improvement and slightly higher clock speeds. That's why I was very surprised to see much higher performance difference in this article for almost all real world tests (Dolphin Benchmark, 3D Particle Movement v2, Mozilla Kraken and Google Octane v2). Personally, I could not find any logical reasons explaining those elevated performance numbers of Skylake i3 CPUs. Can anybody explain me why we see such big (greater than 30%) real world performance differences in all of those tests?KosOR - Tuesday, October 30, 2018 - link
Those higher than 15% performance numbers are also observable in 2 other test results - HandBrake v0.9.9 2x4K and Hybrid x265. Can anybody find the explanation in any of the architecture improvements from Haswell to Skylake generation of CPUs?KosOR - Tuesday, October 30, 2018 - link
Yet another absurd result is of Pentium G3420, which wins over i3 4330 on Dolphin benchmark by more than 15%. It looks absurd that 2 thread, 3.2GHz, 3 MB cache Haswell processor achieves 15% better result over 4 thread, 3.5GHz, 4 MB cache Haswell processor. Such results make me feel suspicious of all other test results on the charts, sorry.