The GIGABYTE Server MW31-SP0 Motherboard Review: A Quick Look at C236
by Ian Cutress on April 21, 2016 10:00 AM EST- Posted in
- Motherboards
- Gigabyte
- Xeon
- Enterprise
- C236
System Performance
Not all motherboards are created equal. On the face of it, they should all perform the same and differ only in the functionality they provide - however this is not the case. The obvious pointers are power consumption, but also the ability for the manufacturer to optimize USB speed, audio quality (based on audio codec), POST time and latency. This can come down to the manufacturing process and prowess, so these are tested.
Power Consumption
Power consumption was tested on the system while in a single MSI GTX 770 Lightning GPU configuration with a wall meter connected to the OCZ 1250W power supply. This power supply is Gold rated, and as I am in the UK on a 230-240 V supply, leads to ~75% efficiency > 50W, and 90%+ efficiency at 250W, suitable for both idle and multi-GPU loading. This method of power reading allows us to compare the power management of the UEFI and the board to supply components with power under load, and includes typical PSU losses due to efficiency. These are the real world values that consumers may expect from a typical system (minus the monitor) using this motherboard.
While this method for power measurement may not be ideal, and you feel these numbers are not representative due to the high wattage power supply being used (we use the same PSU to remain consistent over a series of reviews, and the fact that some boards on our test bed get tested with three or four high powered GPUs), the important point to take away is the relationship between the numbers. These boards are all under the same conditions, and thus the differences between them should be easy to spot.
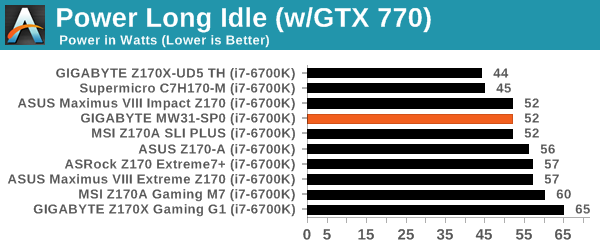
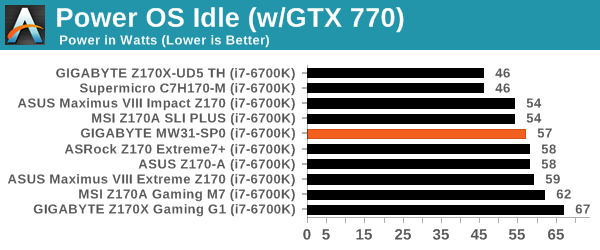
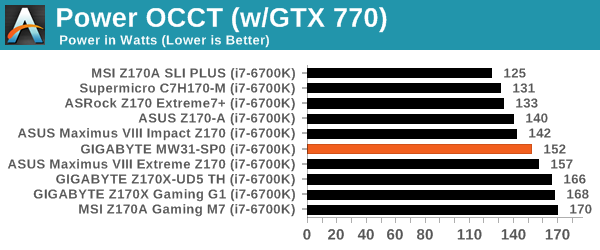
Idle power consumption on the MW31-SP0 was very mid-pack. The idle-to-load power delta with our base i7-6700K CPU was around 100W, which is high compared to a lot of boards we’ve tested.
Non-UEFI POST Time
Different motherboards have different POST sequences before an operating system is initialized. A lot of this is dependent on the board itself, and POST boot time is determined by the controllers on board (and the sequence of how those extras are organized). As part of our testing, we look at the POST Boot Time using a stopwatch. This is the time from pressing the ON button on the computer to when Windows 7 starts loading. (We discount Windows loading as it is highly variable given Windows specific features.)
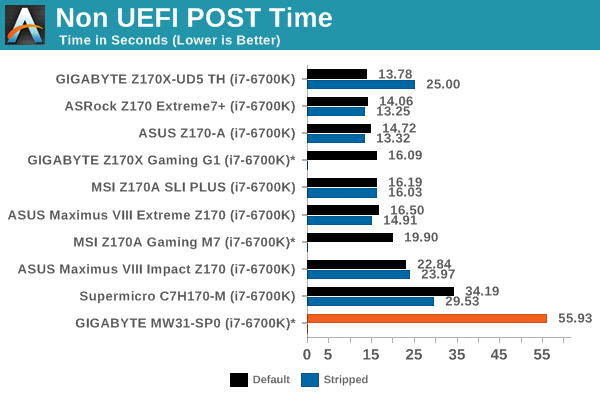
Server/workstation motherboards are not famed for their expediency in POST times, with little effort to improve the time as these systems might not be switched on/off for months at a time. This is why we see the POST time of around a minute for the MW31-SP0. Attempting to strip this to lowest possible POST time was fruitless, causing the system to either fail to boot or take over twice as long.
Rightmark Audio Analyzer 6.2.5
Rightmark:AA indicates how well the sound system is built and isolated from electrical interference (either internally or externally). For this test we connect the Line Out to the Line In using a short six inch 3.5mm to 3.5mm high-quality jack, turn the OS speaker volume to 100%, and run the Rightmark default test suite at 192 kHz, 24-bit. The OS is tuned to 192 kHz/24-bit input and output, and the Line-In volume is adjusted until we have the best RMAA value in the mini-pretest. We look specifically at the Dynamic Range of the audio codec used on board, as well as the Total Harmonic Distortion + Noise.
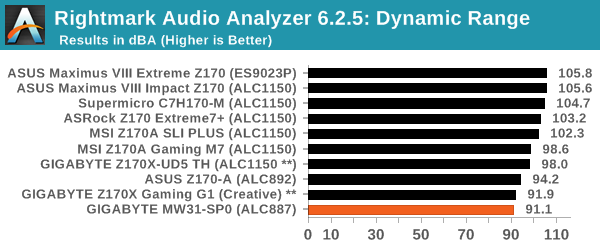
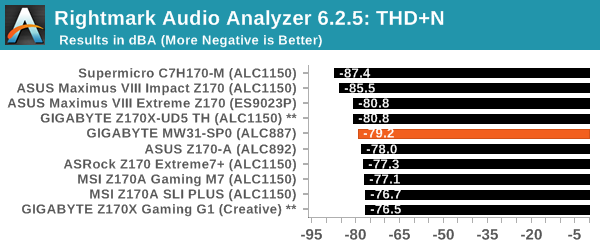
The onboard ALC887 codec is one of the cheapest 7.1 codecs that Realtek offer to motherboard manufacturers, and the price difference to an ALC892 or ALC898 is almost minuscule I wonder why GBT didn’t just go with the slightly higher specification part. Again, one could argue that the sorts of systems that this unit would go into might not ever use audio, and for workstation/office use there only needs to be enough audio to cover the basics.
USB Backup
For this benchmark, we transfer a set size of files from the SSD to the USB drive using DiskBench, which monitors the time taken to transfer. The files transferred are a 1.52 GB set of 2867 files across 320 folders – 95% of these files are small typical website files, and the rest (90% of the size) are small 30 second HD videos. In an update to pre-Z87 testing, we also run MaxCPU to load up one of the threads during the test which improves general performance up to 15% by causing all the internal pathways to run at full speed.
Due to the introduction of USB 3.1, as of June 2015 we are adjusting our test to use a dual mSATA USB 3.1 Type-C device which should be capable of saturating both USB 3.0 and USB 3.1 connections. We still use the same data set as before, but now use the new device. Results are shown as seconds taken to complete the data transfer.
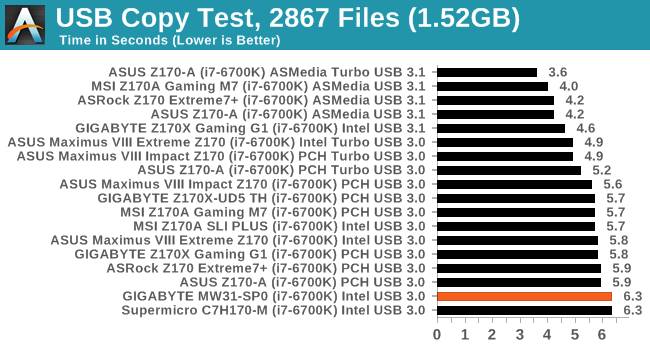
With no USB 3.1 here, we tested the USB 3.0 rear ports with our method. Similar to the Supermicro motherboard we tested, 6.3 seconds seems to be the low-performance metric which the MW31-SP0 matched.
DPC Latency
Deferred Procedure Call latency is a way in which Windows handles interrupt servicing. In order to wait for a processor to acknowledge the request, the system will queue all interrupt requests by priority. Critical interrupts will be handled as soon as possible, whereas lesser priority requests such as audio will be further down the line. If the audio device requires data, it will have to wait until the request is processed before the buffer is filled.
If the device drivers of higher priority components in a system are poorly implemented, this can cause delays in request scheduling and process time. This can lead to an empty audio buffer and characteristic audible pauses, pops and clicks. The DPC latency checker measures how much time is taken processing DPCs from driver invocation. The lower the value will result in better audio transfer at smaller buffer sizes. Results are measured in microseconds.
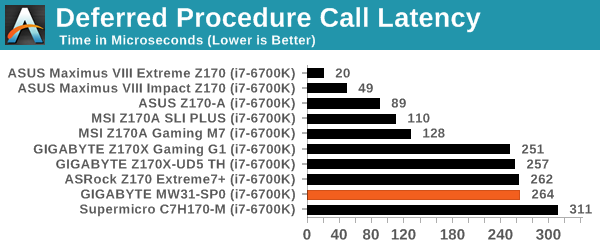
Historic experience would suggest that DPC Latency on server motherboards, like POST time, seems to be a relative afterthought. It doesn’t help that the newer Skylake platforms seem to require firmware and hardware optimization to get the best result, so we often see server motherboards not do well. At 264 microseconds, the MW31-SP0 joins that crowd.


28 Comments
View All Comments
Samus - Friday, April 22, 2016 - link
Ahh DFI, they sealed their fate in the consumer market with the Lanparty line, probably the most unreliable mainstream motherboards ever. It's hard to believe the same company made the legendary Infinity motherboards. Hopefully Supermicro doesn't do the same as they begin to enter the mainstream desktop board market...jabber - Friday, April 22, 2016 - link
Hmmm not how I remember it at the time. Basically if you didn't have a 939 DFI SLi board in your system you just weren't serious. My 939 Lanparty board gave superb service for several years with a Opteron 180, 2GB DDR500, 2 x 7900GTX and a Raptor. Sure they were quirky to configure to get the best out of them but I don't remember them being unreliable, even as a Lanparty Forum member. Still it was 10 years ago.Samus - Friday, April 22, 2016 - link
Depends which board you had. If you remember, the short lived nForce chipset through its 430 and 460 incarnations gave DFI a bad rap for reliability. The boards worked fine until they didn't. Most of the reviews were great initially until 2-3 years went by and the boards all started failing. It wasn't a DFI issue but DFI no doubt made more nForce boards than anybody for overclocking and the long term reliability of those chipset was terrible.The nForce4 goes down in history as one of the highest performing yet most unstable platforms ever. God forbid you actually loaded the nVidia disk controller drivers instead of using the Microsoft default. Except perhaps the Intel 815e and VIA southbridges, those were pretty terrible too.
Some chipsets get a bad rap for no reason though, even recalled ones like the Intel P67. I still have the early non-Ivy Bridge compatible version on an Intel board no less and it's been stable in my HTPC for 5 years running daily...it must have 50,000 hours on it by now.
DanNeely - Friday, April 22, 2016 - link
Everyone's NF4 boards died like crazy though. That doesn't explain why some makers like DFI were destroyed by nVidia's fiasco, while the ones who're still around managed to avoid any reputational damage from it.jabber - Saturday, April 23, 2016 - link
I never had an issue with the nVidia SATA drivers. The only thing that screwed the build was the nVidia Network monitoring/security drivers. I used to help buddies with poor NF4 setups by asking first if they installed that. Yes they had. You only ever tried installing that crap once.danjw - Thursday, April 21, 2016 - link
In the chipset chart you have: "Supports Intel Xeon E5-1200 v5 CPUs" that should be "E3-1200 v5".sivaplus - Friday, April 22, 2016 - link
Indeed. Just because I saw E5-12... I knew there is something fishy here :). Still E5-14xx support would have been nice at this price pointLord 666 - Thursday, April 21, 2016 - link
So frustrating to see the ram maxed out at 64gb. The x99 platform maxes out at 128gb. Hoping a x99 successor arrives supporting skylake CPUskgardas - Thursday, April 21, 2016 - link
Indeed, but this is Intel marketing. For more RAM on Xeon you need to go to D/E5 territory...SFNR1 - Friday, April 22, 2016 - link
Before the v5, there was a limit of 32GB so 64GB is a huge improvement here (finally), but yes, it's a pain. >ou would have to buy a Xeon E5 1x http://ark.intel.com/compare/82767,82766,82765,827... . That pricebump is insane.