ASUS Maximus VII Impact Review: Premium Gaming Z97 in mini-ITX
by Ian Cutress on December 9, 2014 10:00 AM ESTMany thanks to...
We must thank the following companies for kindly providing hardware for our test bed:
Thank you to OCZ for providing us with PSUs and SSDs.
Thank you to G.Skill for providing us with memory.
Thank you to Corsair for providing us with an AX1200i PSU and a Corsair H80i CLC.
Thank you to MSI for providing us with the NVIDIA GTX 770 Lightning GPUs.
Thank you to Rosewill for providing us with PSUs and RK-9100 keyboards.
Thank you to ASRock for providing us with some IO testing kit.
Thank you to Cooler Master for providing us with Nepton 140XL CLCs.
Test Setup
| Test Setup | |
| Processor | Intel Core i7-4770K ES 4 Cores, 8 Threads, 3.5 GHz (3.9 GHz Turbo) |
| Motherboard | ASUS Maximus VII Impact |
| Cooling | Cooler Master Nepton 140XL Corsair H80i Thermaltake TRUE Copper |
| Power Supply | OCZ 1250W Gold ZX Series Corsair AX1200i Platinum PSU |
| Memory | G.Skill RipjawsZ 4x4 GB DDR3-1600 9-11-9 Kit |
| Memory Settings | 1600 9-11-9-27 1T tRFC 240 |
| Video Cards | MSI GTX 770 Lightning 2GB (1150/1202 Boost) |
| Video Drivers | NVIDIA Drivers 337 |
| Hard Drive | OCZ Vertex 3 256GB |
| Optical Drive | LG GH22NS50 |
| Case | Open Test Bed |
| Operating System | Windows 7 64-bit SP1 |
| USB 2/3 Testing | OCZ Vertex 3 240GB with SATA->USB Adaptor |
System Benchmarks
Power Consumption
Power consumption was tested on the system while in a single MSI GTX 770 Lightning GPU configuration with a wall meter connected to the OCZ 1250W power supply. This power supply is Gold rated, and as I am in the UK on a 230-240 V supply, leads to ~75% efficiency > 50W, and 90%+ efficiency at 250W, suitable for both idle and multi-GPU loading. This method of power reading allows us to compare the power management of the UEFI and the board to supply components with power under load, and includes typical PSU losses due to efficiency. These are the real world values that consumers may expect from a typical system (minus the monitor) using this motherboard.
While this method for power measurement may not be ideal, and you feel these numbers are not representative due to the high wattage power supply being used (we use the same PSU to remain consistent over a series of reviews, and the fact that some boards on our test bed get tested with three or four high powered GPUs), the important point to take away is the relationship between the numbers. These boards are all under the same conditions, and thus the differences between them should be easy to spot.
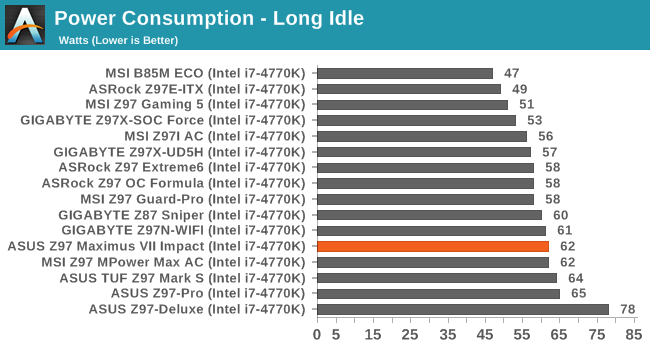
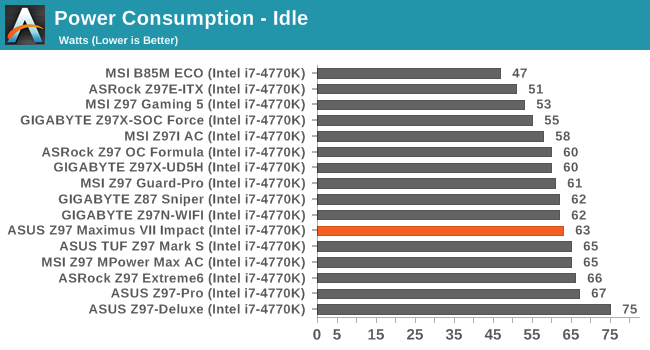
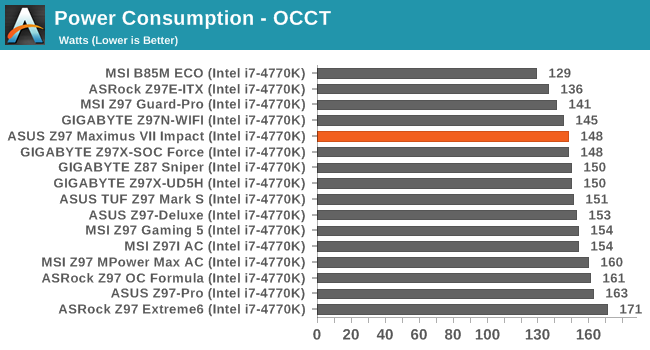
Peak power consumption was just under the 150W mark, resulting in a low idle-to-peak variation of 86W. Idle numbers were actually quite high, though it is hard to pin down if this is down to general design choices or the daughterboard design resulting in small but extra losses.
Windows 7 POST Time
Different motherboards have different POST sequences before an operating system is initialized. A lot of this is dependent on the board itself, and POST boot time is determined by the controllers on board (and the sequence of how those extras are organized). As part of our testing, we look at the POST Boot Time using a stopwatch. This is the time from pressing the ON button on the computer to when Windows 7 starts loading. (We discount Windows loading as it is highly variable given Windows specific features.)
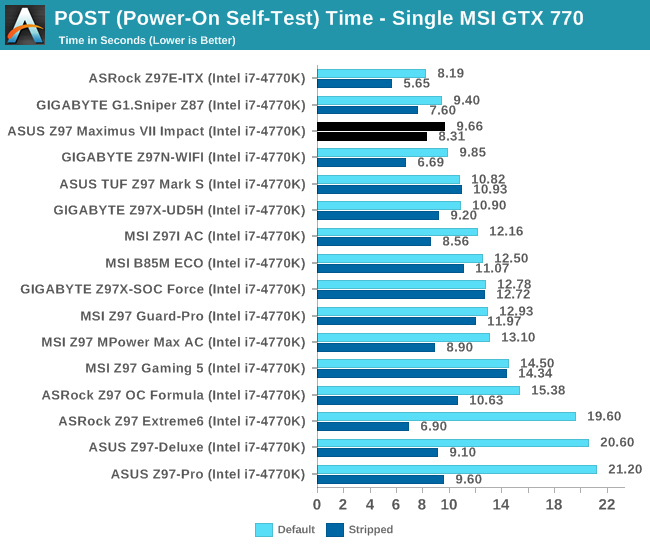
Less than 10 seconds POST time is a good benchmark in which the Impact did well.
Rightmark Audio Analyzer 6.2.5
Rightmark:AA indicates how well the sound system is built and isolated from electrical interference (either internally or externally). For this test we connect the Line Out to the Line In using a short six inch 3.5mm to 3.5mm high-quality jack, turn the OS speaker volume to 100%, and run the Rightmark default test suite at 192 kHz, 24-bit. The OS is tuned to 192 kHz/24-bit input and output, and the Line-In volume is adjusted until we have the best RMAA value in the mini-pretest. We look specifically at the Dynamic Range of the audio codec used on board, as well as the Total Harmonic Distortion + Noise.
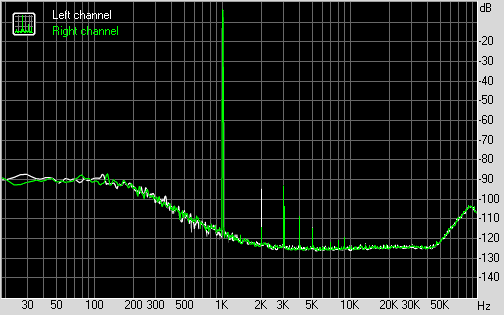
Unfortunately our audio results were a little off due to a defect in our sound system. As shown in the image above, we had an odd situation where less than 300 Hz the THD+N response was some 30 dB different to what we would expect. ASUS sent us some results from a board in their offices that showed normal response, indicating that perhaps mine had a slight issue.
USB Backup
For this benchmark, we transfer a set size of files from the SSD to the USB drive using DiskBench, which monitors the time taken to transfer. The files transferred are a 1.52 GB set of 2867 files across 320 folders – 95% of these files are small typical website files, and the rest (90% of the size) are small 30 second HD videos. In an update to pre-Z87 testing, we also run MaxCPU to load up one of the threads during the test which improves general performance up to 15% by causing all the internal pathways to run at full speed.
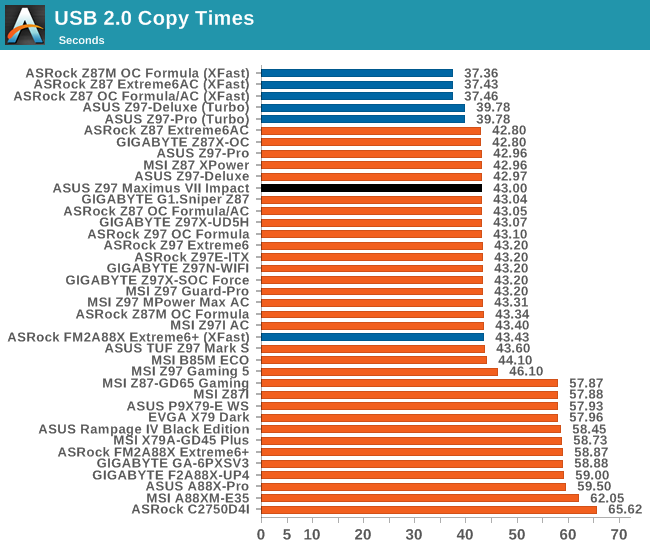
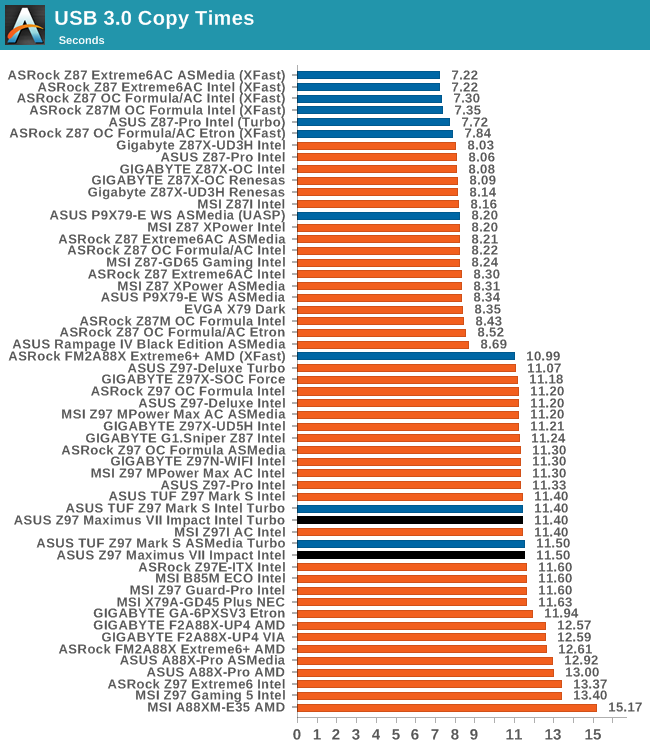
USB 2.0 performance on the Impact was slightly better than our previous Z97 results, with USB 3.0 coming in ballpark.
DPC Latency
Deferred Procedure Call latency is a way in which Windows handles interrupt servicing. In order to wait for a processor to acknowledge the request, the system will queue all interrupt requests by priority. Critical interrupts will be handled as soon as possible, whereas lesser priority requests such as audio will be further down the line. If the audio device requires data, it will have to wait until the request is processed before the buffer is filled.
If the device drivers of higher priority components in a system are poorly implemented, this can cause delays in request scheduling and process time. This can lead to an empty audio buffer and characteristic audible pauses, pops and clicks. The DPC latency checker measures how much time is taken processing DPCs from driver invocation. The lower the value will result in better audio transfer at smaller buffer sizes. Results are measured in microseconds.
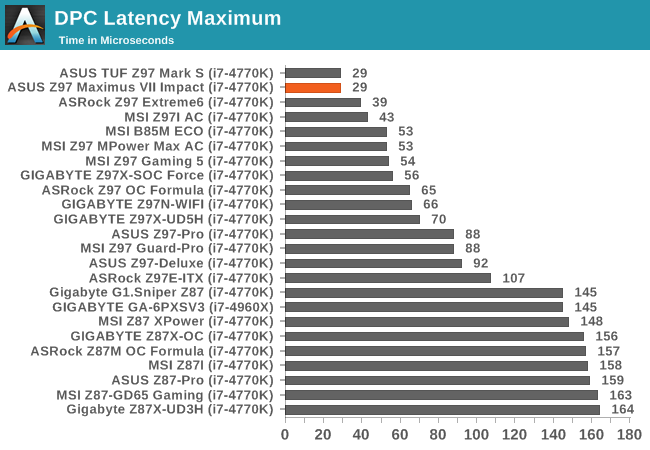
One of the super positive results to come from this review is the DPC Latency. The Impact came in at 29 microseconds, the same as the ASUS TUF Z97 Mark S, matching the best ever result.


41 Comments
View All Comments
TheinsanegamerN - Tuesday, December 9, 2014 - link
looks like a very nice motherboard, if a tad expensive. especially the fan control with custom fan curves...wish my p8-z77 pro had that. wonder why 1.05 volt is the lowest voltage available?ME5H - Tuesday, December 9, 2014 - link
Man these boards are nice! Im pretty sure my next build will be a itx or atx, but for now my 2600k @ 4.8/GTX 780 can handle everything I throw at it. I was this close to buying a used Maximus for my 2600k but didnt trust them coming from Hong Kong :/ Thanks for the review. Peacevarg14 - Tuesday, December 9, 2014 - link
I am in the same boat with my CPU I have falling in love with going on 4 years old. A good ole Sandy Bridge i7 2600k @ 4.9ghz on a p67-ud4-b3 MB with 2 EVGA GTX 770 4GB Classifieds in SLI I do not see a CPU upgrade coming until PCI-E 2.0 @8X start limiting GPU performance at high res and settings. As of now you only see a real difference between 3.0 and 2.0 at low res with low settings.Morawka - Wednesday, December 10, 2014 - link
the real hero are the millions of i7 920's still in circulation. You can get one on ebay for like $75. Quad core with HT ftwmapesdhs - Thursday, December 11, 2014 - link
CPUs for P55 still run nicely too (cheaper than X58 CPUs, less power, easier to oc). I recently
tested an i5 760 @ 4.2GHz with single/dual 7970 3GB, it was easily able to match or beat a
5GHz 2700K with a single GTX 980. I can't post the URL here, but Google for, "SGI Ian pc
benchmarks". I tested with Stalker COP, CoJ, FC2, all the Unigine tests, and the 3DMark suites.
Only down side of Lynnfield CPUs is that P55 mbds have become highly valued for some
bizarre reason.
Best used value atm though is a Z68 board and a 2500K, as the mbds go for diddly.
Ian.
Samus - Thursday, December 11, 2014 - link
True the i7-920 (even the 950) are cheap, but a decent X58 board still sells for $200. I know because I just sold my Asus P6X Deluxe for that much on eBay. It's ridiculous how much these boards command, but I kind of get it, they're ridiculously good. I feel my H87's stability pales in comparison...but I wanted to do an ITX rig so the negligible performance increase and PCIe 3.0 weren't really the selling factors over X58.mooninite - Tuesday, December 9, 2014 - link
This review is a little late. The board has been for sale for a couple months now. There is one issue I've had with my board and it's with Turbo settings. The default core ratio settings are to sync all cores. This will bring your CPU outside of its rated spec and in the case of a i7 4790k it will cause your CPU to overheat and throttle at extreme loads. At first I thought I had a defective CPU, but after investigation the board is maxing out at 4.4ghz with 4 cores instead of 4.2ghz. With the correct settings my CPU does not throttle and stays within thermal limits. With an aftermarket cooler I can run at 4.4ghz on all cores, but just barely.This Turbo / stock CPU cooler issue should be a good topic for Anandtech to investigate. It seems many (all?) motherboards have wrong defaults for this and stock coolers cannot do the job.
varg14 - Tuesday, December 9, 2014 - link
Really overheats on stock voltage? What Cooler you using ? Also have you tried undervolting a tiny bit?Zap - Wednesday, December 10, 2014 - link
tl;drThis board (along with many other "enthusiast" boards) overclocks the CPU by default through "multicore enhancement." It has been around for a few years, and AnandTech even had an article about it.
http://www.anandtech.com/show/6214/multicore-enhan...
mooninite - Thursday, December 11, 2014 - link
No, I specifically said *default* settings. Not with XMP. Not with Multi-core-enhancement. ASUS, Gigabyte, and others are, by default, syncing ratios on all cores.