Samsung SSD 850 EVO (120GB, 250GB, 500GB & 1TB) Review
by Kristian Vättö on December 8, 2014 10:00 AM ESTRandom Read/Write Speed
The four corners of SSD performance are as follows: random read, random write, sequential read and sequential write speed. Random accesses are generally small in size, while sequential accesses tend to be larger and thus we have the four Iometer tests we use in all of our reviews.
Our first test writes 4KB in a completely random pattern over an 8GB space of the drive to simulate the sort of random access that you'd see on an OS drive (even this is more stressful than a normal desktop user would see). We perform three concurrent IOs and run the test for 3 minutes. The results reported are in average MB/s over the entire time.
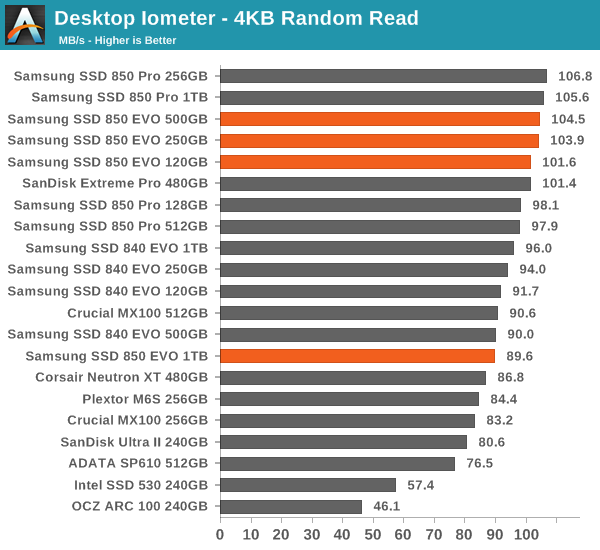
The models with the new MGX controller enjoy excellent random read performance, although the 1TB version isn't bad either. Without knowing the specifications of the MGX controller, it's hard to know what is causing the performance increase, but I still suspect it is due to a higher clock speed.
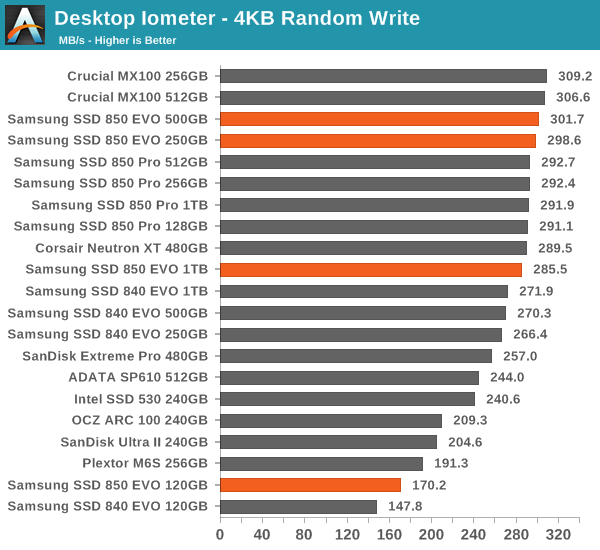
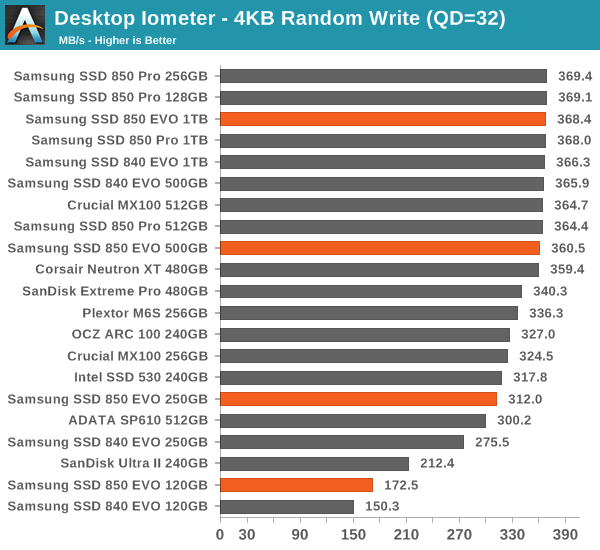
Random write performance also sees an increase across all capacities and is more or less on par with the 850 Pro at larger capacities.
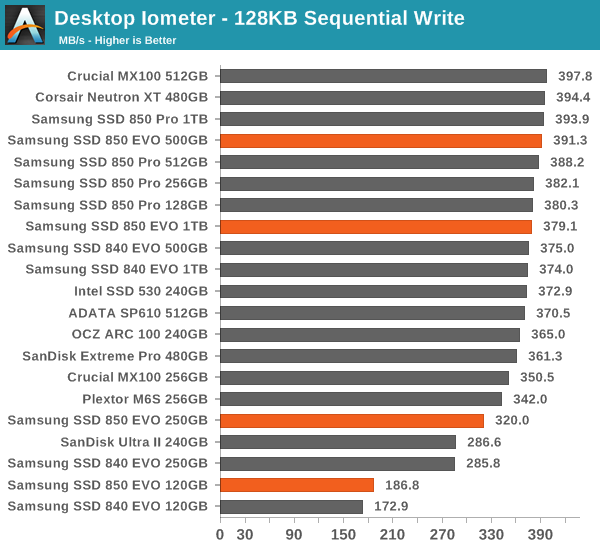
Sequential Read/Write Speed
To measure sequential performance we run a 1 minute long 128KB sequential test over the entire span of the drive at a queue depth of 1. The results reported are in average MB/s over the entire test length.
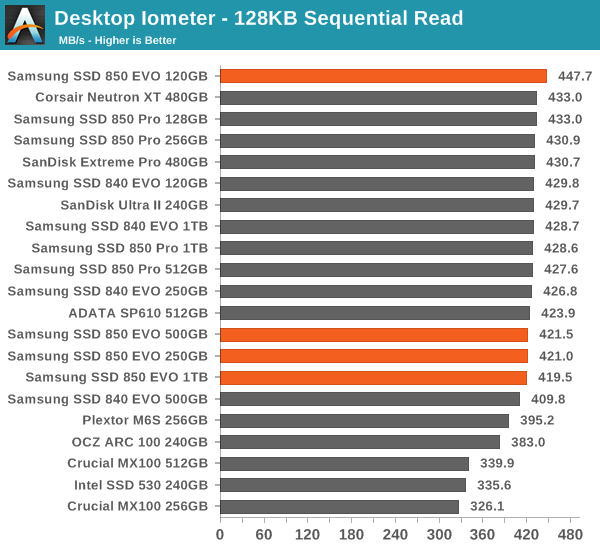
Sequential performance doesn't present any real surprises. Write speed at smaller capacities gets a small boost, but other than that the performance is typical SATA 6Gbps level.
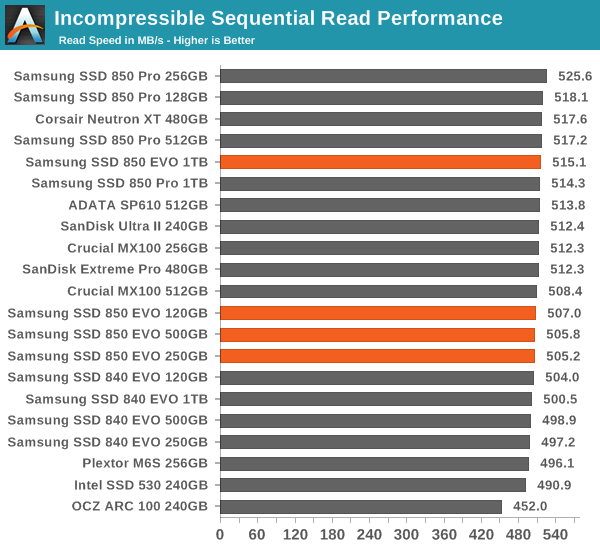
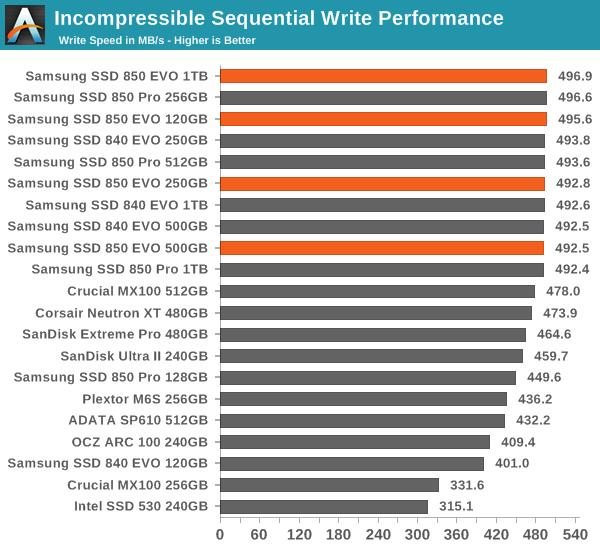
AS-SSD Incompressible Sequential Read/Write Performance
The AS-SSD sequential benchmark uses incompressible data for all of its transfers. The result is a pretty big reduction in sequential write speed on SandForce based controllers, but most other controllers are unaffected.


97 Comments
View All Comments
TheWrongChristian - Monday, December 8, 2014 - link
Performance consistency wise, the MEX controller on the 1TB drive looks better than the MGX controller on the smaller drives. I guess this is the loss of a cpu core at work, but I figure there'll be no discernible difference to the user experience.All in all, looks like a nice drive, a reasonable upgrade to the existing 840 evo drives. Just hope the V-NAND cost brings the whole price down to compelling levels as the process matures.
Solid State Brain - Monday, December 8, 2014 - link
As for the Wear Leveling Count, it might actually be taking into account that a fixed portion of the installed NAND is used in SLC mode for the TurboWrite buffer. The 120GB model has 128GiB of NAND, of which 9 GiB are used for 3 GiB TurboWrite Buffer, so that makes 119 GiB of TLC capacity for both overprovisioning and user addressable space.By the way, this also implies that because of TurboWrite these Samsung EVO SSDs (including the previous 840 EVO) have less overprovisioning space than most other SSDs.
Solid State Brain - Monday, December 8, 2014 - link
Yikes! This was not meant to be in response to TheWrongChristian.hojnikb - Monday, December 8, 2014 - link
>What I do know is that Samsung started the mass production of TLC V-NAND later, which suggests that the two aren't completely uniform. Moreover, from what I know TLC NAND requires some changes to the peripheral circuitry in order to read three bits from one cell, so while the NAND memory arrays could be alike the die size is still likely at least slightly different.Is it possible, that samsung designed 2nd gen 3D with TLC in mind (eg requred peripheral circuitry) and simply set the controller in 850PRO to use 4 states instead of 8 (so MLC). I mean, it kinda makes sense to go this way, but not the other way around....
Solid State Brain - Monday, December 8, 2014 - link
@Kristian VättöDo you have any information from Samsung about whether the TurboWrite SLC buffer also helps decreasing the write amplification like on the SanDisk Ultra II with nCache 2.0?
Kristian Vättö - Tuesday, December 9, 2014 - link
Unfortunately I don't. It was among the questions I sent but unfortunately Samsung couldn't get any of my questions answered on time for the review.Solid State Brain - Wednesday, December 10, 2014 - link
Too bad that you couldn't get an answer in time. According to my observations from other people's drives, it really looks like the Turbowrite does help on that regard. Try checking out my thread on the Memory and Storage forum.This phenomenon (write amplification just over or below 1.0x) is likely not going to show up during reviews or heavy usage since generally the drives get secure erased often and/or get hammered with writes which end up filling the Turbowrite SLC buffer.
Daniel Egger - Monday, December 8, 2014 - link
It would be nice to have some older drives in the charts to get some perspective on whether a drive would make a good upgrade choice. For an upgrade the available space and the space/price ratio are probably the most important aspects but some features or a major speed increase might sweeten the deal even more. ;)sheh - Monday, December 8, 2014 - link
Not perfect of always complete, but usable:http://www.anandtech.com/bench/SSD/65
Kvaern - Monday, December 8, 2014 - link
It's my anecdotal experience that all these awesome benchmark figures means absolutely nothing for the average user.Case in point I upgraded from an old 60GB corsair drive to an EVO840 which on paper is like twice as fast as the Corsair but in reality my user experience is exactly the same.