Intel Haswell-EP Xeon 12 Core Review: E5-2650L V3 and E5-2690 V3
by Ian Cutress on November 6, 2014 9:00 AM EST- Posted in
- CPUs
- IT Computing
- Intel
- Xeon
- Enterprise
- LGA2011-3
- Haswell EP
CPU Benchmarks
The dynamics of CPU Turbo modes, both Intel and AMD, can cause concern during environments with a variable threaded workload. There is also an added issue of the motherboard remaining consistent, depending on how the motherboard manufacturer wants to add in their own boosting technologies over the ones that Intel would prefer they used. In order to remain consistent, we implement an OS-level unique high performance mode on all the CPUs we test which should override any motherboard manufacturer performance mode.
HandBrake v0.9.9: link
For HandBrake, we take two videos (a 2h20 640x266 DVD rip and a 10min double UHD 3840x4320 animation short) and convert them to x264 format in an MP4 container. Results are given in terms of the frames per second processed, and HandBrake uses as many threads as possible.
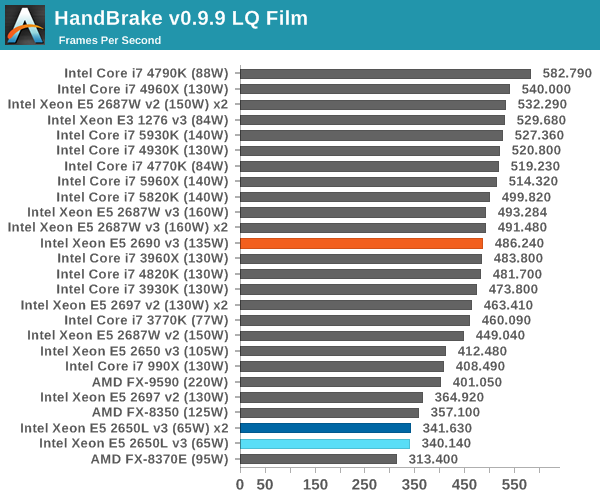
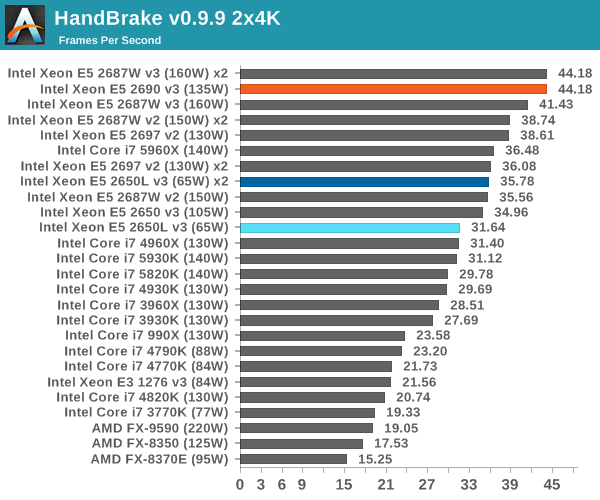
With the low single core speed of the 2650L v3, processing smaller frames can be rather slow. When the size of the frames is larger, and reside in the computational parts of the cores for longer, a better speedup is achieved. However, the 2690 v3 still wins out.
Agisoft Photoscan – 2D to 3D Image Manipulation: link
Agisoft Photoscan creates 3D models from 2D images, a process which is very computationally expensive. The algorithm is split into four distinct phases, and different phases of the model reconstruction require either fast memory, fast IPC, more cores, or even OpenCL compute devices to hand. Agisoft supplied us with a special version of the software to script the process, where we take 50 images of a stately home and convert it into a medium quality model. This benchmark typically takes around 15-20 minutes on a high end PC on the CPU alone, with GPUs reducing the time.
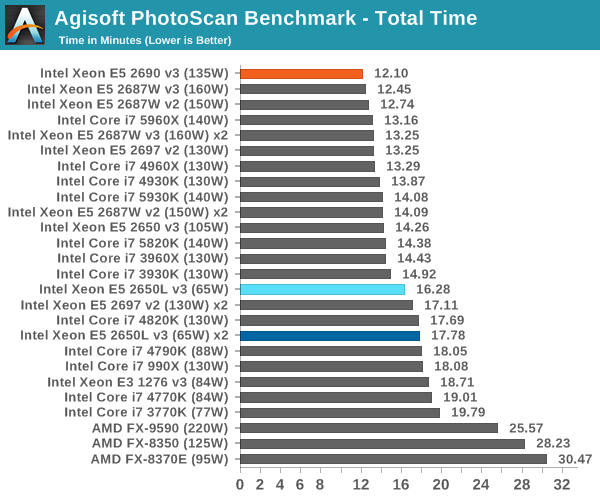
Photoscan is part single thread and part multithread, and the combination of the two puts the 2690 v3 well ahead of the 2650L v3 x2 despite double the cores.
Dolphin Benchmark: link
Many emulators are often bound by single thread CPU performance, and general reports tended to suggest that Haswell provided a significant boost to emulator performance. This benchmark runs a Wii program that raytraces a complex 3D scene inside the Dolphin Wii emulator. Performance on this benchmark is a good proxy of the speed of Dolphin CPU emulation, which is an intensive single core task using most aspects of a CPU. Results are given in minutes, where the Wii itself scores 17.53 minutes.
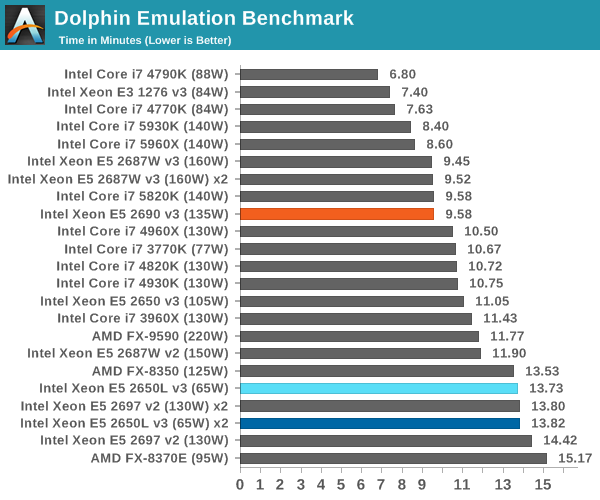
Dolphin is purely single threaded, and the 2690 v3 sits on par with the 5820K.
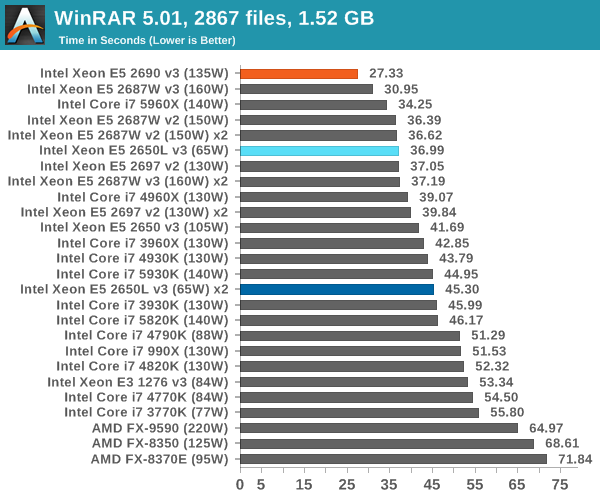
WinRAR 5.0.1: link
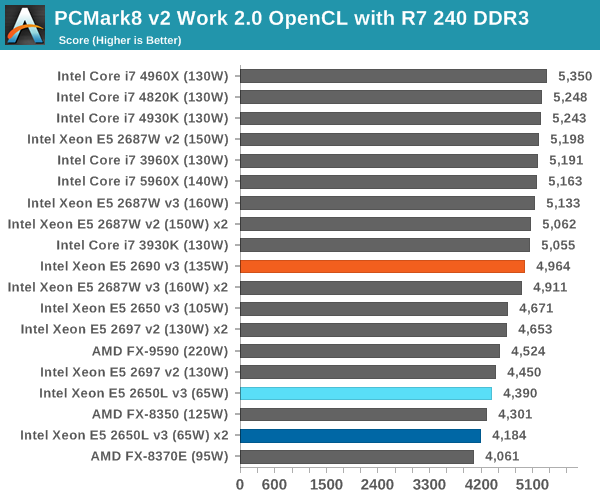
PCMark8 v2 OpenCL
A new addition to our CPU testing suite is PCMark8 v2, where we test the Work 2.0 suite in OpenCL mode.
Hybrid x265
Hybrid is a new benchmark, where we take a 4K 1500 frame video and convert it into an x265 format without audio. Results are given in frames per second.
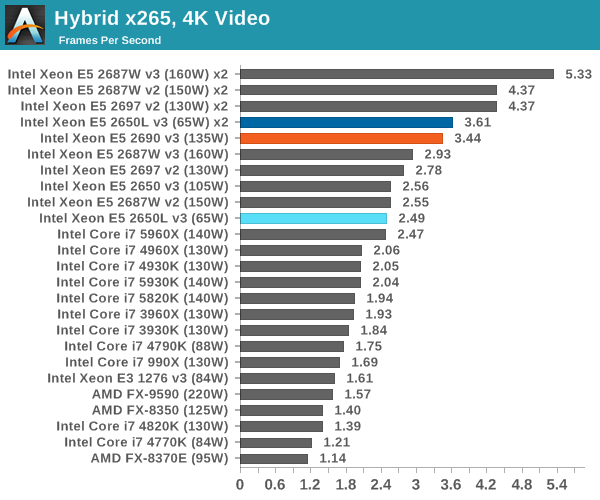
For x265 conversion, more cores rules the roost and we see the 2650L v3 x2 setup surpass the 2690 v3. Although the 0.17 FPS difference might not be worth the $600 outlay depending on how much x265 encoding you do.
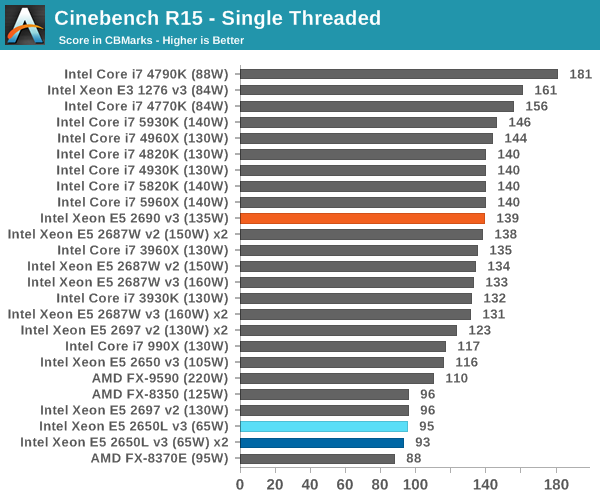
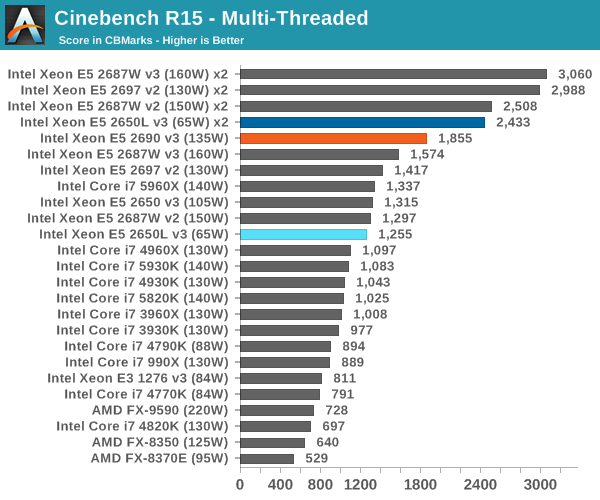
Cinebench R15
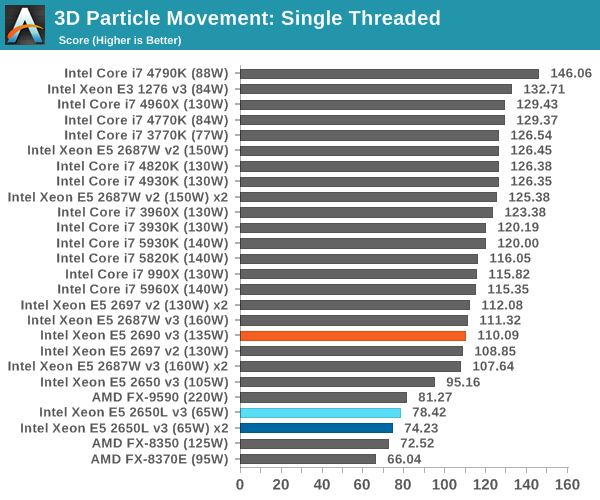
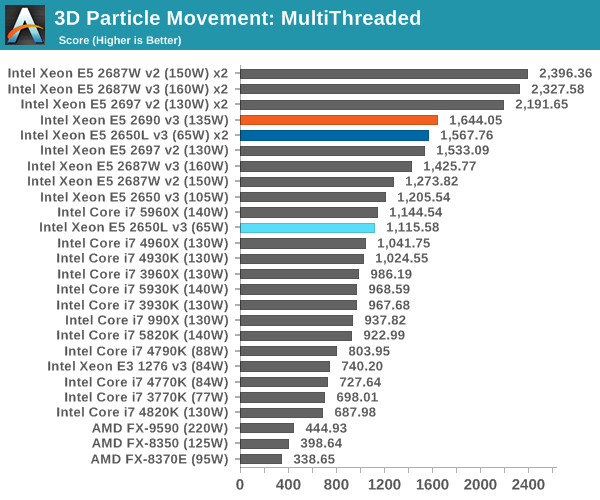
3D Particle Movement
3DPM is a self-penned benchmark, taking basic 3D movement algorithms used in Brownian Motion simulations and testing them for speed. High floating point performance, MHz and IPC wins in the single thread version, whereas the multithread version has to handle the threads and loves more cores.
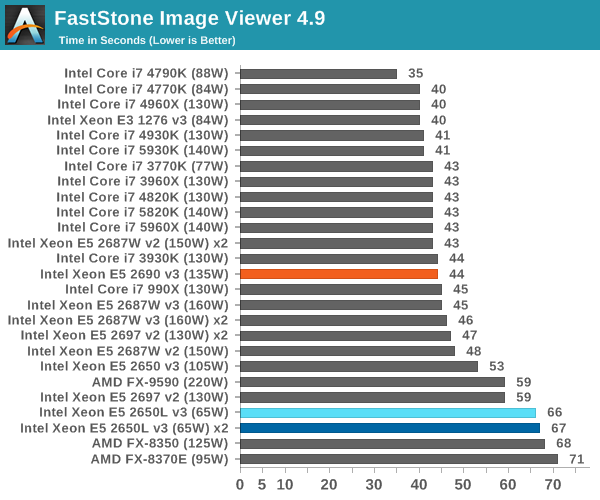
FastStone Image Viewer 4.9
FastStone is the program I use to perform quick or bulk actions on images, such as resizing, adjusting for color and cropping. In our test we take a series of 170 images in various sizes and formats and convert them all into 640x480 .gif files, maintaining the aspect ratio. FastStone does not use multithreading for this test, and results are given in seconds.
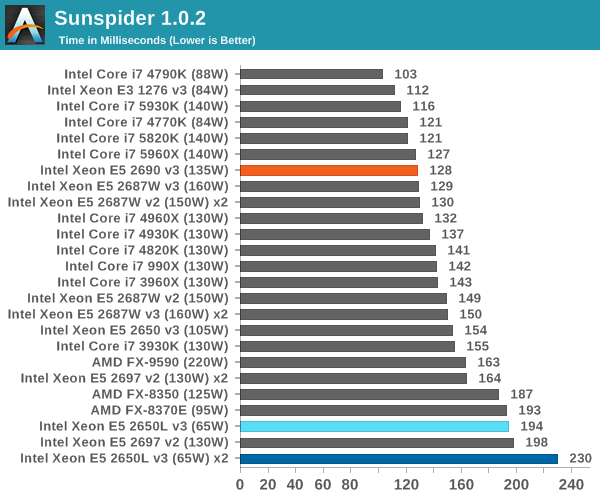
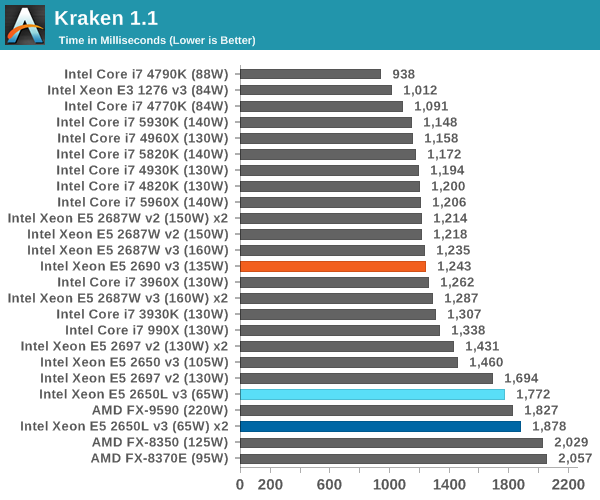
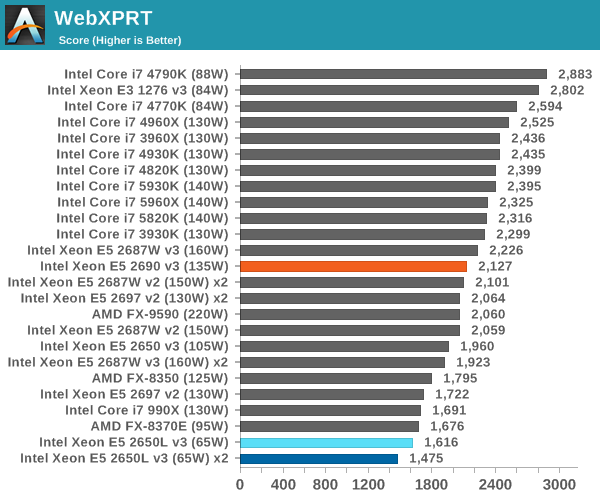
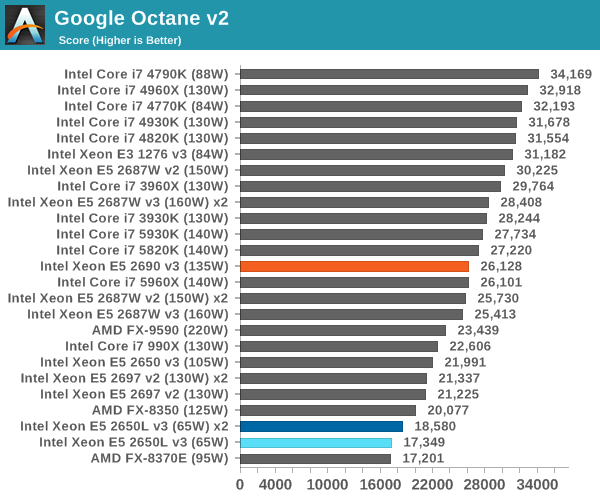
Web Benchmarks
General usability is a big factor of experience, especially as we move into the HTML5 era of web browsing. For our web benchmarks, we take four well known tests with Chrome 35 as a consistent browser.
Sunspider 1.0.2
Mozilla Kraken 1.1
WebXPRT
Google Octane v2


52 Comments
View All Comments
XZerg - Thursday, November 6, 2014 - link
I really dislike the Power Consumpution Delta chart. Could you please go back to separate Idle chart and Load chart?Mikemk - Thursday, November 6, 2014 - link
+1klagermkii - Thursday, November 6, 2014 - link
I don't understand the purpose of that chart. It leaves too much ambiguity between CPUs that are efficient at load vs CPUs that just have poor idle power management.ziorus - Thursday, November 6, 2014 - link
100% agree with XZerg. I was coming to this site because you had the idle and load charts. Those two infos really are needed. Not this delta chart. We do not even know where power consumption in watts at idle starts to add in the numbers.Guspaz - Thursday, November 6, 2014 - link
Agreed. The delta is basically useless information, because it gives a CPU with a power range of 10W-20W and a CPU with a power range of 100W-110W the same score, and tells us nothing about how much power the part actually draws (so we can't use the info to size PSUs) or how much heat it might produce (so we can't use the info to size cooling).The delta is, without the idle/load, completely meaningless.
Schafdog - Thursday, November 6, 2014 - link
I want to join the club to complain on only one (delta) power measurement. Idle is important. Max is important.MrCommunistGen - Saturday, November 8, 2014 - link
I think that the Delta chart is designed to give an apples to apples comparison of how much power the CPU itself consumes under load. The platforms of all of those systems are vastly different. There's a range of motherboards from single socket consumer IVB to dual socket workstation/server Haswell and everything in between. While a comparison of raw platform power under idle and load certainly bears its own merit and and represents an interesting set of figures, it does not provide a meaningful comparison for the subject of this article - a CPU.Delta power allows for all kinds of comparisons. Regardless of motherboard, RAM, etc you can establish that a given CPU will use (approximately) X number of watts under load. If you then provide performance figures for that load, you can get the compute efficiency of the CPU. In big data clusters, especially ones that primarily perform a specific workload this is an important figure.
0ldman79 - Monday, November 10, 2014 - link
Delta chart is fine. We still want to see idle and max load.Call me old fashioned.
danjw - Thursday, November 6, 2014 - link
First paragraph in "Market" "bandwidth contained applications" should be "bandwidth constrained applications", I think.rocketscience315 - Thursday, November 6, 2014 - link
Um, isn't the Frequency Response graph missing the 2648L?