SanDisk Extreme Pro SSD (240GB, 480GB & 960GB) Review: The Fastest Just Got Faster
by Kristian Vättö on June 16, 2014 4:00 PM EST- Posted in
- Storage
- SSDs
- SanDisk
- Extreme Pro
AnandTech Storage Bench 2013
Our Storage Bench 2013 focuses on worst-case multitasking and IO consistency. Similar to our earlier Storage Benches, the test is still application trace based - we record all IO requests made to a test system and play them back on the drive we are testing and run statistical analysis on the drive's responses. There are 49.8 million IO operations in total with 1583.0GB of reads and 875.6GB of writes. I'm not including the full description of the test for better readability, so make sure to read our Storage Bench 2013 introduction for the full details.
| AnandTech Storage Bench 2013 - The Destroyer | ||
| Workload | Description | Applications Used |
| Photo Sync/Editing | Import images, edit, export | Adobe Photoshop CS6, Adobe Lightroom 4, Dropbox |
| Gaming | Download/install games, play games | Steam, Deus Ex, Skyrim, Starcraft 2, BioShock Infinite |
| Virtualization | Run/manage VM, use general apps inside VM | VirtualBox |
| General Productivity | Browse the web, manage local email, copy files, encrypt/decrypt files, backup system, download content, virus/malware scan | Chrome, IE10, Outlook, Windows 8, AxCrypt, uTorrent, AdAware |
| Video Playback | Copy and watch movies | Windows 8 |
| Application Development | Compile projects, check out code, download code samples | Visual Studio 2012 |
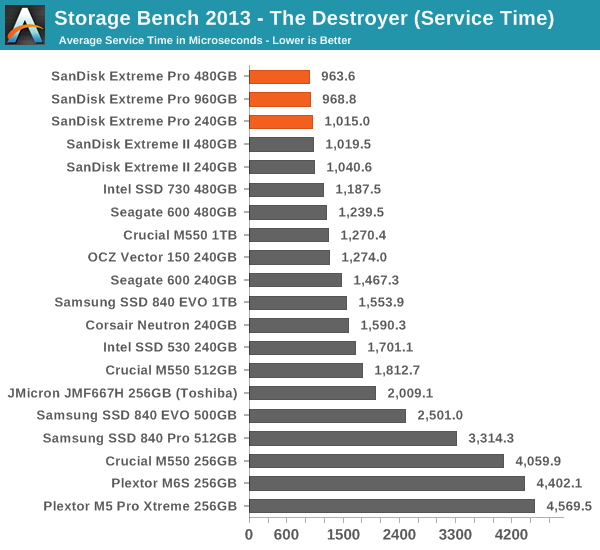
We are reporting two primary metrics with the Destroyer: average data rate in MB/s and average service time in microseconds. The former gives you an idea of the throughput of the drive during the time that it was running the test workload. This can be a very good indication of overall performance. What average data rate doesn't do a good job of is taking into account response time of very bursty (read: high queue depth) IO. By reporting average service time we heavily weigh latency for queued IOs. You'll note that this is a metric we have been reporting in our enterprise benchmarks for a while now. With the client tests maturing, the time was right for a little convergence.
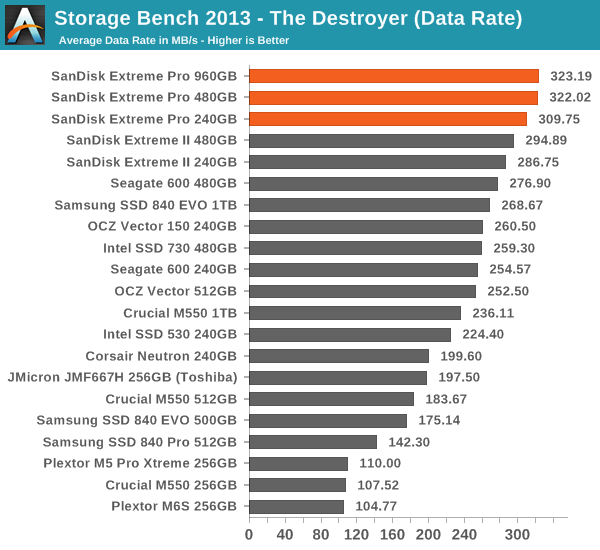
Given that the Extreme II was already dominating the Storage Bench 2013, it doesn't come as a surprise that the Extreme Pro is the new crownholder. Even the SSD 730 and Vector 150 can't challenge the Extreme Pro despite the fact that in terms of pure random write performance they are better. I think SanDisk's strength lies in mixed read/write performance because write performance alone does not yield good results in real world workloads, which tend to be a mix of reads and writes.
In fact, client workloads (like our Storage Benches) are usually more read-centric anyway and in the case of the Extreme Pro, the drive spent over three times longer processing read IOs than write IOs, which makes sense because there are nearly four times more read IOs than there are write IOs in the trace (even though in terms of gigabytes the difference is only twofold).


85 Comments
View All Comments
fackamato - Monday, June 16, 2014 - link
Nice. Time to replace the old Intel 320 in RAID0 perhaps.MikeMurphy - Monday, June 16, 2014 - link
I always like a good review, but I'm finding SSD benchmarks difficult to respect when the real-world difference between this drive and the MX100 will be invisible to most users.Samus - Tuesday, June 17, 2014 - link
I agree, Ferrari's vs Lamborghini's. Anybody coming from a hard drive or even a last-gen SSD (like an Intel X25) isn't going to notice the difference between a $100 MX100 and a $200 Sandisk Extreme Pronathanddrews - Tuesday, June 17, 2014 - link
No one will notice... except people that can and do distinguish between Ferraris and Lambos. I would imagine that someone that could tell the difference between a WD Velociraptor and a Seagate Barracuda would notice the difference between these two drives. Different users have different needs, that should be obvious.MyrddinE - Tuesday, June 17, 2014 - link
The issue is that many power users *think* they can tell the difference, but fail to in blind tests. This has been proven true frequently, usually in relation to more subjective domains like audio, but it applies everywhere. Sit a user at two computers, one overclocked 5%, one not, and it's likely not a single power user will be able to tell without a FPS meter or perf test result.nathanddrews - Tuesday, June 17, 2014 - link
Depends on what operation is boosted by 5%. If 5% allows you to maintain solid vsync vs dips, then you sure as heck will be able to tell. If 5% is the difference between completing 5% more editing projects in the same amount of time, then people who spend more will see a benefit. There's always a case to be made for measurable improvements.I'm sorry, but the audiophile straw man doesn't apply here.
Chaser - Tuesday, June 17, 2014 - link
A 5 % performance difference with selective benchmarks using higher end SSD WON'T be noticed in real world user experiences. No need to apologize.Kristian Vättö - Tuesday, June 17, 2014 - link
5%? The difference between 240GB Extreme Pro and 256GB MX100 is more like 162% in the Storage Bench 2013...http://www.anandtech.com/bench/product/1240?vs=122...
Bear in mind that that's real-world IOs played back on the drive, so it's not as synthetic as e.g. Iometer tests are.
TheWrongChristian - Wednesday, June 18, 2014 - link
It's entirely synthetic, even if derived from real trace data.As I understand it, the trace is replayed as fast as possible. In the real world, the trace probably would have been collected over a period of hours or days. In those time frames, different levels of near instantaneous is the same if it's too quick for human perception. Consider the microcontroller controlling your washing machine. It does all it needs to do fast enough, that adding a 10000% faster CPU won;t make your washing clean any quicker.
Plus, in the real world, other factors come into play. Had the trace been replayed in real time (as in takes as long to replay as to collect, pauses and all) different drives will do things like background GC, which will improve performance of the next burst of activity. A drive that takes 162% as long to replay the trace at full speed may complete the real time trace within milliseconds of the faster drive. Result, no perceptible difference to the user.
Kristian Vättö - Wednesday, June 18, 2014 - link
Maximum idle time (i.e. when QD=0) is set to 25 seconds, otherwise the trace is played as it was collected. Sure that's still not the same as playing it back in real time but it's still quite a bit of time for the SSD to do GC.