Plextor M6S & M6M (256GB) Review
by Kristian Vättö on April 10, 2014 6:00 AM ESTAnandTech Storage Bench 2013
Our Storage Bench 2013 focuses on worst-case multitasking and IO consistency. Similar to our earlier Storage Benches, the test is still application trace based—we record all IO requests made to a test system and play them back on the drive we're testing and run statistical analysis on the drive's responses. There are 49.8 million IO operations in total with 1583.0GB of reads and 875.6GB of writes. I'm not including the full description of the test for better readability, so make sure to read our Storage Bench 2013 introduction for the full details.
| AnandTech Storage Bench 2013 - The Destroyer | ||
| Workload | Description | Applications Used |
| Photo Sync/Editing | Import images, edit, export | Adobe Photoshop CS6, Adobe Lightroom 4, Dropbox |
| Gaming | Download/install games, play games | Steam, Deus Ex, Skyrim, Starcraft 2, BioShock Infinite |
| Virtualization | Run/manage VM, use general apps inside VM | VirtualBox |
| General Productivity | Browse the web, manage local email, copy files, encrypt/decrypt files, backup system, download content, virus/malware scan | Chrome, IE10, Outlook, Windows 8, AxCrypt, uTorrent, AdAware |
| Video Playback | Copy and watch movies | Windows 8 |
| Application Development | Compile projects, check out code, download code samples | Visual Studio 2012 |
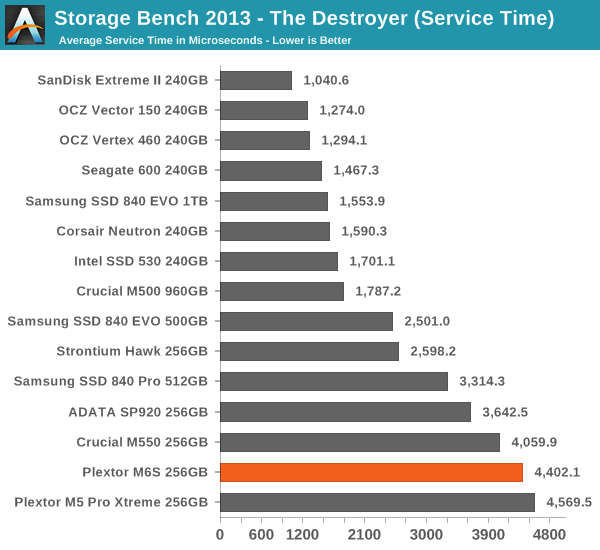
We are reporting two primary metrics with the Destroyer: average data rate in MB/s and average service time in microseconds. The former gives you an idea of the throughput of the drive during the time that it was running the test workload. This can be a very good indication of overall performance. What average data rate doesn't do a good job of is taking into account response time of very bursty (read: high queue depth) IO. By reporting average service time we heavily weigh latency for queued IOs. You'll note that this is a metric we've been reporting in our enterprise benchmarks for a while now. With the client tests maturing, the time was right for a little convergence.
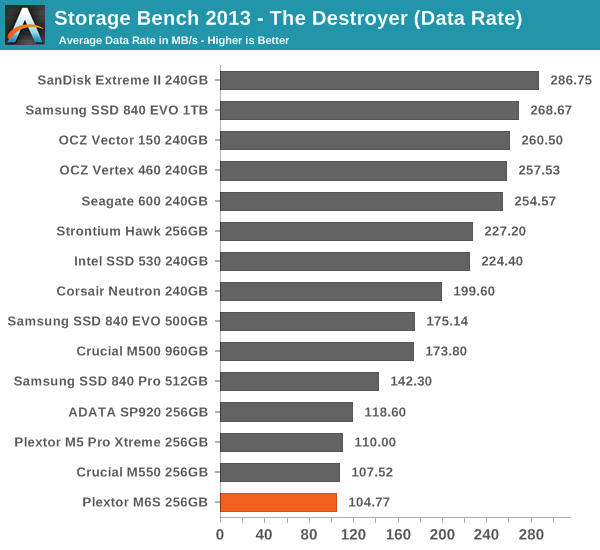
The IO consistency already hinted that the M6S wouldn't perform very well in The Destoyer and that is indeed the case. The performance is slightly down from the M5 Pro Xtreme and is overall similar to the Crucial M550. Both of these drives have only 7% over-provisioning, which definitely hurts the benchmarks scores as there is unfortunately no way to test with added over-provisioning. It's hard to say how much the scores would improve with 12% over-provisioning but Toshiba (the Strontium Hawk is a rebranded Toshiba drive with a Marvell controller) is able to achieve more than twice the performance without any added over-provisioning, so there should certainly be room for improvement even without touching the over-provisioning.


30 Comments
View All Comments
prime2515103 - Thursday, April 10, 2014 - link
I find it disappointing how average Plextor has become, yet they keep their pricing at a point where one might expect to get something at least slightly exceptional.I do have an M5M in my laptop and haven't had any problems with it, so I'll give them that. The selection of mSATA drives was pretty sparse when I bought it though, and it was on sale for $108 (which was quite good at the time), otherwise it definitely would not have been my first choice.
Cellar Door - Thursday, April 10, 2014 - link
I agree, I will be going with samsung evo for my msata drive. Very disappointing for the price.Samus - Thursday, April 10, 2014 - link
M500 is still the best deal for an average, reliable SSD. Great for basic business and family PC's.rufuselder - Thursday, October 9, 2014 - link
Me too. But either way, there are some much better storage options out there. /Rufus from http://www.consumertop.com/best-computer-storage-g...dylan522p - Thursday, April 10, 2014 - link
That was good basic explanation of the differences between everyones NAND! Thanks for doing that.nathanddrews - Thursday, April 10, 2014 - link
The pictures of the IMFT and Samsung processes are all clean and uniform... the Toshiba and Hynix processes look like a 3-year-old with a crayon made them.zodiacsoulmate - Thursday, April 10, 2014 - link
yea... why they look like that? maybe they are hard to color? why they look so random...extide - Thursday, April 10, 2014 - link
LOL, I noticed that too, it's like, geez how does that stuff even work! Looks so sloppy!Kristian Vättö - Friday, April 11, 2014 - link
Keep in mind that the diameter of the photo is a few dozen nanometers and it's extremely hard to achieve 100% precision with lithographies that small. At least IMFT has been using air gaps before and it's a mature process for them but Toshiba and Hynix added them to the current generation, making it quite new for them.creed3020 - Thursday, April 10, 2014 - link
Kristian thanks for such an in-depth technical and product review. I really appreciate how in your reviews graphs are accompanied with text explaining the results and providing an opinion on the results. I can read a graph but interpretation of those graphs and data trends is often missing from reviews here at AT.I am surprised that such a new drive isn't also available in M2 format but I guess they have the M6e for that. Is there a review of that drive coming as well?