ASUS Rampage IV Black Edition Review
by Ian Cutress on January 5, 2014 10:00 AM EST- Posted in
- Motherboards
- Intel
- Asus
- X79
Rightmark Audio Analyzer 6.2.5
In part due to reader requests, we are pleased to include Rightmark Audio Analyzer results in our benchmark suite. The premise behind Rightmark:AA is to test the input and output of the audio system to determine noise levels, range, harmonic distortion, stereo crosstalk and so forth. Rightmark:AA should indicate how well the sound system is built and isolated from electrical interference (either internally or externally). For this test we connect the Line Out to the Line In using a short six inch 3.5mm to 3.5mm high-quality jack, turn the OS speaker volume to 100%, and run the Rightmark default test suite at 192 kHz, 24-bit. The OS is tuned to 192 kHz/24-bit input and output, and the Line-In volume is adjusted until we have the best RMAA value in the mini-pretest. We look specifically at the Dynamic Range of the audio codec used on board, as well as the Total Harmonic Distortion + Noise.
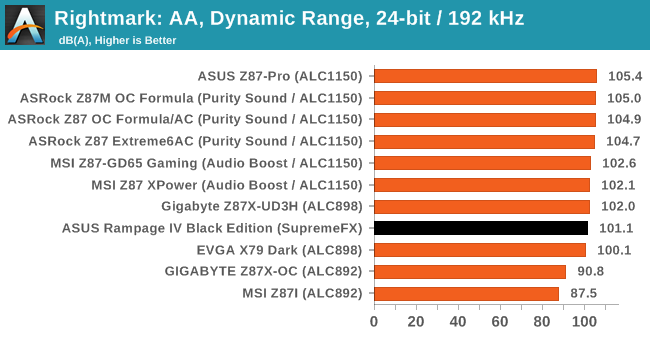
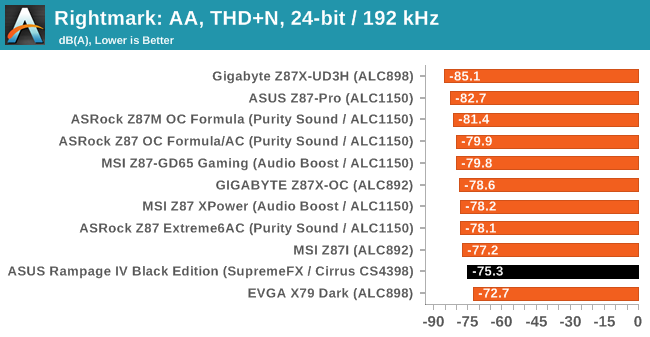
Results from the RIVBE were not as impressive as I had hoped, despite the use of SupremeFX. This may be filtered back to the chipset talking to the audio codec as required – the newer codecs always seem to work better with the latest platforms.
Edit: After retesting the audio, SNR went from 95.1 to 101.1 dB(A), suggesting an issue in the first batch of testing. At 101.1 dB(A), we are now into the 100+ with the RIVE, although the Z87-Pro solution is fairing better in our test.
USB Backup
For this benchmark, we run CrystalDiskMark to determine the ideal sequential read and write speeds for the USB port using our 240 GB OCZ Vertex3 SSD with a SATA 6 Gbps to USB 3.0 converter. Then we transfer a set size of files from the SSD to the USB drive using DiskBench, which monitors the time taken to transfer. The files transferred are a 1.52 GB set of 2867 files across 320 folders – 95% of these files are small typical website files, and the rest (90% of the size) are the videos used in the WinRAR test. In an update to pre-Z87 testing, we also run MaxCPU to load up one of the threads during the test which improves general performance up to 15% by causing all the internal pathways to run at full speed.
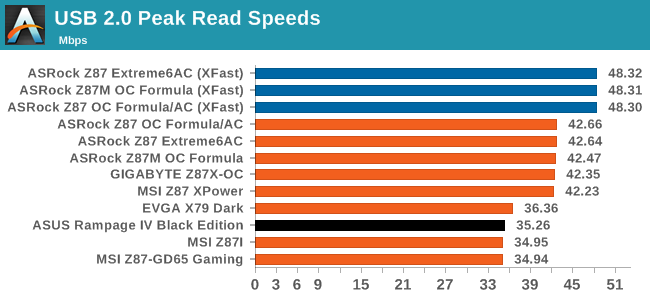
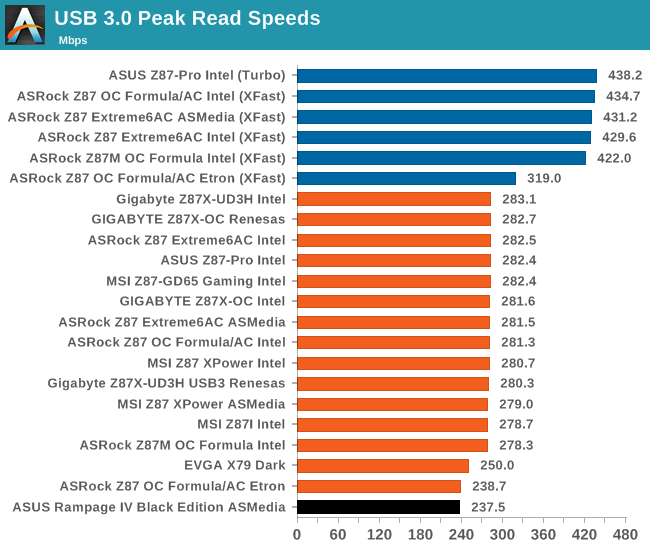
USB speed seemed a little on the lacklustre (in terms of pure numbers) side all around. In the USB 3.0 stakes of course we are dealing with no native ports, but even still there leaves some room to go beyond those of the X79 Dark.
DPC Latency
Deferred Procedure Call latency is a way in which Windows handles interrupt servicing. In order to wait for a processor to acknowledge the request, the system will queue all interrupt requests by priority. Critical interrupts will be handled as soon as possible, whereas lesser priority requests, such as audio, will be further down the line. So if the audio device requires data, it will have to wait until the request is processed before the buffer is filled. If the device drivers of higher priority components in a system are poorly implemented, this can cause delays in request scheduling and process time, resulting in an empty audio buffer – this leads to characteristic audible pauses, pops and clicks. Having a bigger buffer and correctly implemented system drivers obviously helps in this regard. The DPC latency checker measures how much time is processing DPCs from driver invocation – the lower the value will result in better audio transfer at smaller buffer sizes. Results are measured in microseconds and taken as the peak latency while cycling through a series of short HD videos - under 500 microseconds usually gets the green light, but the lower the better.
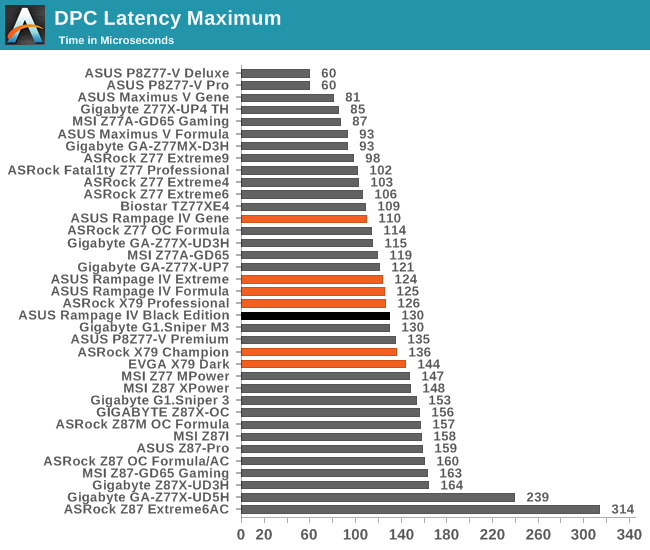
DPC Latency for the RIVBE surpasses any Z87 platform we have tested (not sure if there is a bug on Z87 which causes this), and 130 microseconds is in the ballpark for a good X79 based DAW.
WiFi Speeds
With the advent of 802.11ac now part of the motherboard space, it made sense to bring in hardware to test the wireless capabilities of the packages we review. Our test scenario is as follows – the router is located five meters away from the test bed and the signal has to travel through a concrete internal wall. The router is in a flat complex with over 25 access points within 50 meters, mostly on 2.4 GHz. We use a LAN Speed Test server on an i3-3225 based system connected via Ethernet to the D-Link 802.11ac router and then the LAN Speed Test client on the host machine. We set up a one hour continuous test using 10 simultaneous streams each sending then receiving 50 MB across the connection. Results are then plotted as a histogram of the data.
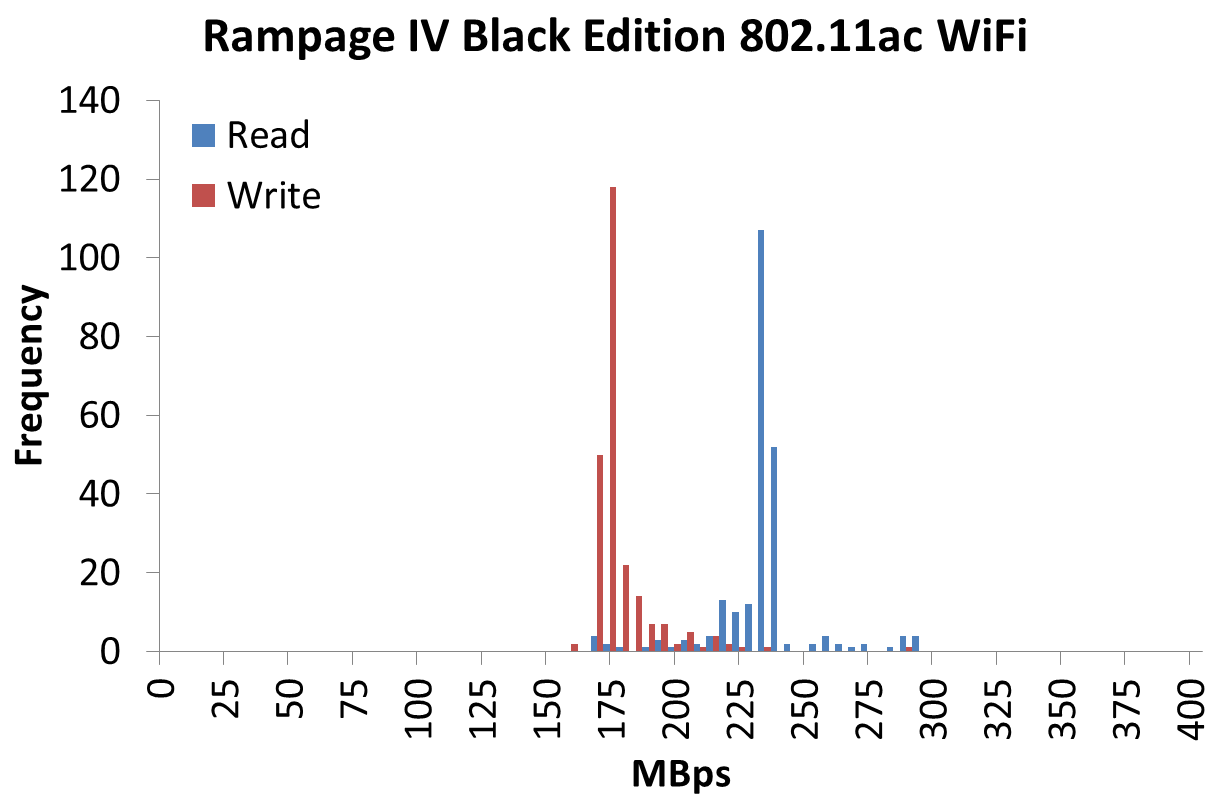
*Units in the graph should be Mbps, not MBps.
Despite using a 2T2R dual band 802.11ac WiFi, the speeds we achieved using our normal setup were not as good as I had hoped.


21 Comments
View All Comments
JlHADJOE - Sunday, January 5, 2014 - link
Wait, so the Auto-OC actually beat your manual OC results? Impressive!The table says Auto-OC managed to get 47/47/46/46/45/45 stable where your manual OC maxed out at 45, and it also got 45x100 stable at less volts and lower temps than manual.
Razorbak86 - Sunday, January 5, 2014 - link
The PovRay score for the 45x100 manual OC was higher, the voltage was lower, and the OCCT temp was lower. I'd say the 4.5GHz manual OC beat the Auto-OC hands down.JlHADJOE - Monday, January 6, 2014 - link
Auto OC: 45x100, 1.400V BIOS, 1.408V load, 77CManual OC: 45x100, 1.425V BIOS, 1.440V load, 80C
Slightly higher Povray is probably just variance, or down to something other than the CPU (perhaps XMP timings). I'd say the Auto-OC was better.
IanCutress - Sunday, January 5, 2014 - link
For the manual OC I only adjust the voltage, CPU multiplier and the CPU load line calibration, which is pretty much what most users will do when manually overclocking unless told otherwise (or there's another setting you must adjust). It's clear the Auto-OC does a bit more under the hood (VCCSA/VSSIO voltages most likely) - at the expense of a higher voltage (to catch more processors). In my test, I also only focus on all cores the same speed, and the stress test attacks all cores, rather than single cores that might be higher turboed. There is scope to go playing around with all the settings, which is what the ROG forums are there to do for users who have only one motherboard every couple of years to organise :)jasonelmore - Sunday, January 5, 2014 - link
I've found that disabling the C States of power saving features such as speed step has drastically improved my max overclock on the Rampage IV Extereme BESamus - Sunday, January 5, 2014 - link
$500!? yeooow.Gen-An - Sunday, January 5, 2014 - link
Ian,Have you seen any noticeable difference in memory OC using the Black Edition vs the original RIVE with the same CPU and RAM? People on various forums are saying the BE is more optimized for IB-E and memory OC, but I haven't been able to find anything definitive to support that statement.
jigglywiggly - Sunday, January 5, 2014 - link
why's the first picture skewed lol?great review as always ;D
IanCutress - Sunday, January 5, 2014 - link
I haven't stressed the RIVE with Ivy-E and high (2800+) memory yet, although this motherboard was designed with Ivy Bridge-E as the focus after ASUS finished the Maximus VI range. So if there are optimisations for Ivy-E above the RIVE that are more than just BIOS, the RIVBE should have them. So while I don't have any data, I expect that would be the case. Now whether faster memory is actually useful for a given workload is a different matter...Gen-An - Wednesday, January 8, 2014 - link
Just interested for the OC fun factor, 24/7 I run DDR3-2400 C9.