SanDisk Extreme II Review (480GB, 240GB, 120GB)
by Anand Lal Shimpi on June 3, 2013 7:19 PM ESTAnandTech Storage Bench 2011
Two years ago we introduced our AnandTech Storage Bench, a suite of benchmarks that took traces of real OS/application usage and played them back in a repeatable manner. I assembled the traces myself out of frustration with the majority of what we have today in terms of SSD benchmarks.
Although the AnandTech Storage Bench tests did a good job of characterizing SSD performance, they weren't stressful enough. All of the tests performed less than 10GB of reads/writes and typically involved only 4GB of writes specifically. That's not even enough exceed the spare area on most SSDs. Most canned SSD benchmarks don't even come close to writing a single gigabyte of data, but that doesn't mean that simply writing 4GB is acceptable.
Originally I kept the benchmarks short enough that they wouldn't be a burden to run (~30 minutes) but long enough that they were representative of what a power user might do with their system.
Not too long ago I tweeted that I had created what I referred to as the Mother of All SSD Benchmarks (MOASB). Rather than only writing 4GB of data to the drive, this benchmark writes 106.32GB. It's the load you'd put on a drive after nearly two weeks of constant usage. And it takes a *long* time to run.
1) The MOASB, officially called AnandTech Storage Bench 2011 - Heavy Workload, mainly focuses on the times when your I/O activity is the highest. There is a lot of downloading and application installing that happens during the course of this test. My thinking was that it's during application installs, file copies, downloading and multitasking with all of this that you can really notice performance differences between drives.
2) I tried to cover as many bases as possible with the software I incorporated into this test. There's a lot of photo editing in Photoshop, HTML editing in Dreamweaver, web browsing, game playing/level loading (Starcraft II & WoW are both a part of the test) as well as general use stuff (application installing, virus scanning). I included a large amount of email downloading, document creation and editing as well. To top it all off I even use Visual Studio 2008 to build Chromium during the test.
The test has 2,168,893 read operations and 1,783,447 write operations. The IO breakdown is as follows:
| AnandTech Storage Bench 2011 - Heavy Workload IO Breakdown | ||||
| IO Size | % of Total | |||
| 4KB | 28% | |||
| 16KB | 10% | |||
| 32KB | 10% | |||
| 64KB | 4% | |||
Only 42% of all operations are sequential, the rest range from pseudo to fully random (with most falling in the pseudo-random category). Average queue depth is 4.625 IOs, with 59% of operations taking place in an IO queue of 1.
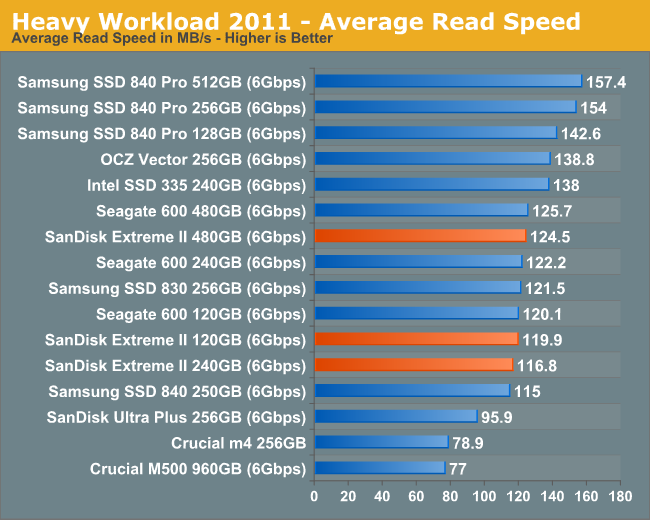
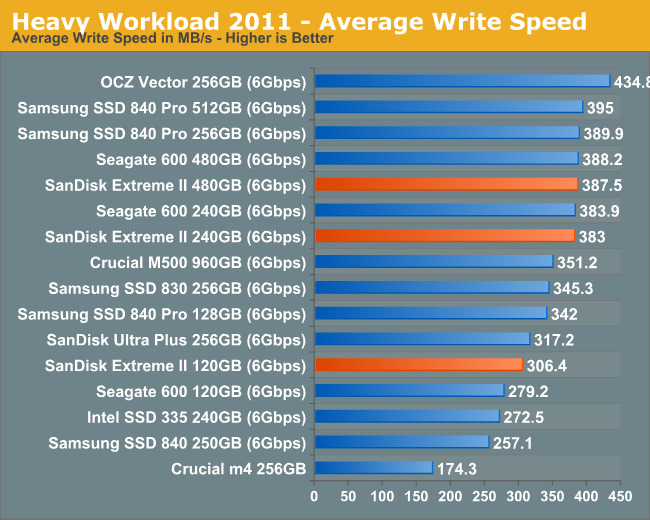
Many of you have asked for a better way to really characterize performance. Simply looking at IOPS doesn't really say much. As a result I'm going to be presenting Storage Bench 2011 data in a slightly different way. We'll have performance represented as Average MB/s, with higher numbers being better. At the same time I'll be reporting how long the SSD was busy while running this test. These disk busy graphs will show you exactly how much time was shaved off by using a faster drive vs. a slower one during the course of this test. Finally, I will also break out performance into reads, writes and combined. The reason I do this is to help balance out the fact that this test is unusually write intensive, which can often hide the benefits of a drive with good read performance.
There's also a new light workload for 2011. This is a far more reasonable, typical every day use case benchmark. Lots of web browsing, photo editing (but with a greater focus on photo consumption), video playback as well as some application installs and gaming. This test isn't nearly as write intensive as the MOASB but it's still multiple times more write intensive than what we were running in 2010.
As always I don't believe that these two benchmarks alone are enough to characterize the performance of a drive, but hopefully along with the rest of our tests they will help provide a better idea.
The testbed for Storage Bench 2011 has changed as well. We're now using a Sandy Bridge platform with full 6Gbps support for these tests.
AnandTech Storage Bench 2011 - Heavy Workload
We'll start out by looking at average data rate throughout our new heavy workload test:
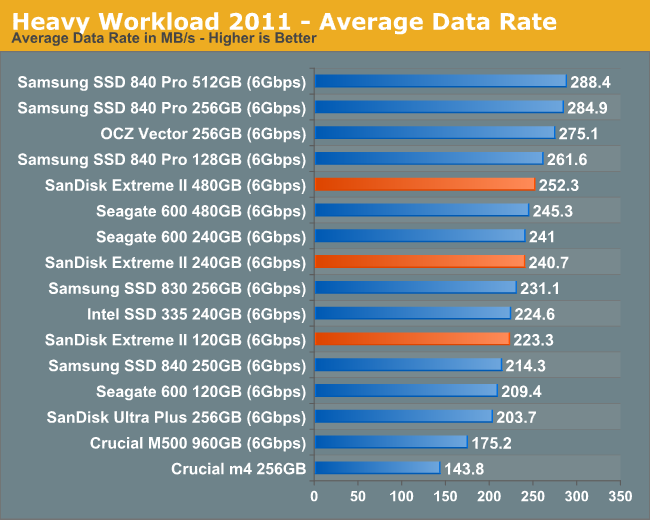
The Extreme II's peak performance isn't as good as the 840 Pro or OCZ Vector, but it's definitely very quick.
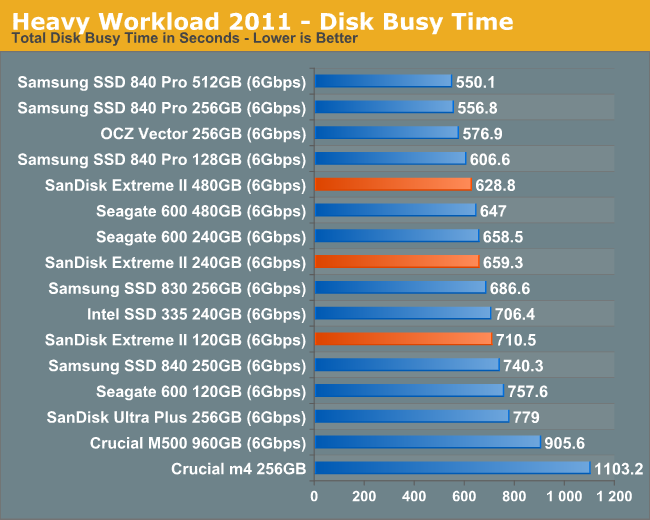
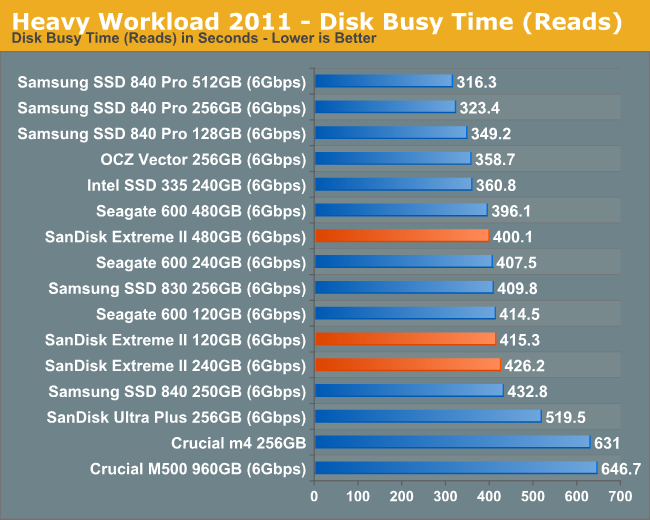
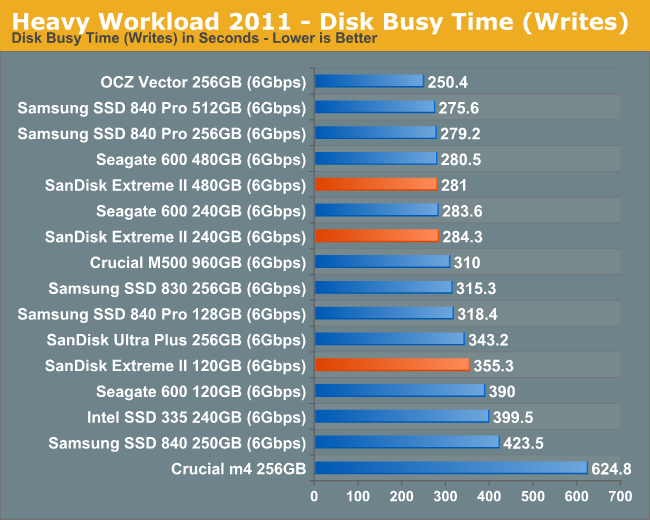
The next three charts just represent the same data, but in a different manner. Instead of looking at average data rate, we're looking at how long the disk was busy for during this entire test. Note that disk busy time excludes any and all idles, this is just how long the SSD was busy doing something:


51 Comments
View All Comments
Quizzical - Monday, June 3, 2013 - link
Good stuff, as usual. But at what point do SSD performance numbers cease to matter because they're all so fast that the difference doesn't matter?Back when there were awful JMicron SSDs that struggled along at 2 IOPS in some cases, the difference was extremely important. More recently, your performance consistency numbers offered a finer grained way to say that some SSDs were flawed.
But are we heading toward a future in which most SSDs do well in any test that you can come up with shows all of the SSDs performing well? Does the difference between 10000 IOPS and 20000 really matter for any consumer use? How about the difference between 300 MB/s and 400 MB/s in sequential transfers? If so, do we declare victory and cease caring about SSD reviews?
If so, then you could claim some part in creating that future, at least if you believe that vendors react to flaws that reviews point out, even if only because they want to avoid negative reviews of their own products.
Or maybe it will be like power supply reviews, where mostly only good ones get sent in for reviews, while bad ones just show up on New Egg and hope that some sucker will buy it, or occasionally get a review when some tech site buys one rather than getting a review sample sent from the manufacturer?
Tukano - Monday, June 3, 2013 - link
I feel the same way. Almost need an order of magnitude improvement to notice anything different.My question now is, where are the bottlenecks?
What causes my PC to boot in 30 seconds as opposed to 10?
I don't think I ever use the same amount of throughput as what these SSD's offer
My 2500K @ 4.5GHz doesn't seem to ever get stressed (I didn't notice a huge difference between stock vs OC)
Is it now limited to the connections between devices? i.e. transferring from SSD to RAM to CPU and vice versa?
talldude2 - Monday, June 3, 2013 - link
Storage is still the bottleneck for performance in most cases. Bandwidth between CPU and DDR3 1600 is 12.8GB/s. The fastest consumer SSDs are still ~25 times slower than that in a best case scenario. Also, you have to take into account all the different latencies associated with any given process (i.e. fetch this from the disk, fetch that from the RAM, do an operation on them, etc.). The reduced latency is really what makes the SSD so much faster than an HDD.As for the tests - I think that the new 2013 test looks good in that it will show you real world heavy usage data. At this point it looks like the differentiator really is worst case performance - i.e. the drive not getting bogged down under a heavy load.
whyso - Monday, June 3, 2013 - link
Its twice that If you have two RAM sticks.Chapbass - Monday, June 3, 2013 - link
I came in to post that same thing, talldude2. Remember why RAM is around in the first place: Storage is too slow. Even with SSDs, the latency is too high, and the performance isn't fast enough.Hell, I'm not a programmer, but perhaps more and more things could be coded differently if they knew for certain that 90-95% of customers have a high performance SSD. That changes a lot of the ways that things can be accessed, and perhaps frees up RAM for more important things. I don't know this for a fact, but if the possibility is there you never know.
Either way, back to my original point, until RAM becomes redundant, were not fast enough, IMO.
FunBunny2 - Monday, June 3, 2013 - link
-- Hell, I'm not a programmer, but perhaps more and more things could be coded differently if they knew for certain that 90-95% of customers have a high performance SSD.It's called an organic normal form relational schema. Lot's less bytes, lots more performance. But the coder types hate it because it requires so much less coding and so much more thinking (to build it, not use it).
crimson117 - Tuesday, June 4, 2013 - link
> It's called an organic normal form relational schemaI'm pretty sure you just made that up... or you read "Dr. Codd Was Right" :P
FunBunny2 - Tuesday, June 4, 2013 - link
When I was an undergraduate, freshman actually, whenever a professor (english, -ology, and such) would assign us to write a paper, we'd all cry out, "how long does it have to be????" One such professor replied, "organic length, as long as it has to be." Not very satisfying, but absolutely correct.When I was in grad school, a professor mentioned that he'd known one guy who's Ph.D. dissertation (economics, mathy variety) was one page long. An equation and its derivation. Not sure I believe that one, but it makes the point.
santiagoanders - Tuesday, June 4, 2013 - link
I'm guessing you didn't get a graduate degree in English. "Whose" is possessive while "who's" is a contraction that means "who is."FunBunny2 - Tuesday, June 4, 2013 - link
Econometrics. But, whose counting?