Intel Z87 Motherboard Review with Haswell: Gigabyte, MSI, ASRock and ASUS
by Ian Cutress on June 27, 2013 8:00 AM EST- Posted in
- Motherboards
- Intel
- MSI
- Gigabyte
- ASRock
- Asus
- Haswell
- Z87
- Shark Bay
- Lynx Point
Rightmark Audio Analyzer 6.2.5
In part due to reader requests, we are pleased to include Rightmark Audio Analyzer results in our benchmark suite. The premise behind Rightmark:AA is to test the input and output of the audio system to determine noise levels, range, harmonic distortion, stereo crosstalk and so forth. Rightmark:AA should indicate how well the sound system is built and isolated from electrical interference (either internally or externally). For this test we connect the Line Out to the Line In using a short six inch 3.5mm to 3.5mm high-quality jack, turn the OS speaker volume to 100%, and run the Rightmark default test suite at 192 kHz, 24-bit. The OS is tuned to 192 kHz/24-bit input and output, and the Line-In volume is adjusted until we have the best RMAA value in the mini-pretest. We look specifically at the Dynamic Range of the audio codec used on board, as well as the Total Harmonic Distortion + Noise.
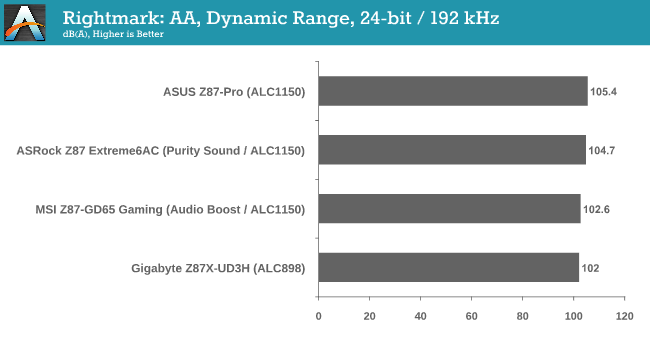
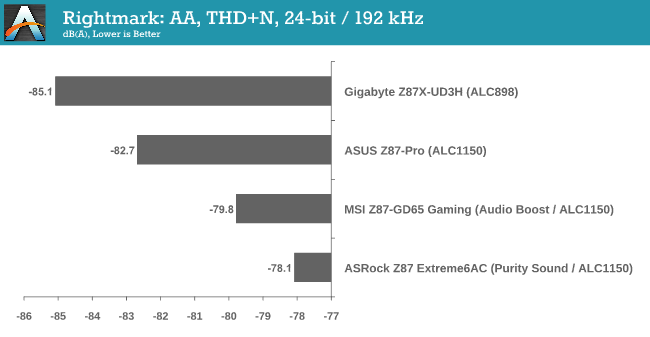
The ASUS Z87-Pro audio solution is the best of both worlds, hitting above 105 dBA in our test and below -82 dBA for THD+N. Surprisingly the ALC898 gets the best THD+N result.
USB Backup
For this benchmark, we run CrystalDiskMark to determine the ideal sequential read and write speeds for the USB port using our 240 GB OCZ Vertex3 SSD with a SATA 6 Gbps to USB 3.0 converter. Then we transfer a set size of files from the SSD to the USB drive using DiskBench, which monitors the time taken to transfer. The files transferred are a 1.52 GB set of 2867 files across 320 folders – 95% of these files are small typical website files, and the rest (90% of the size) are the videos used in the WinRAR test. In an update to pre-Z87 testing, we also run MaxCPU to load up one of the threads during the test which improves general performance up to 15% by causing all the internal pathways to run at full speed.
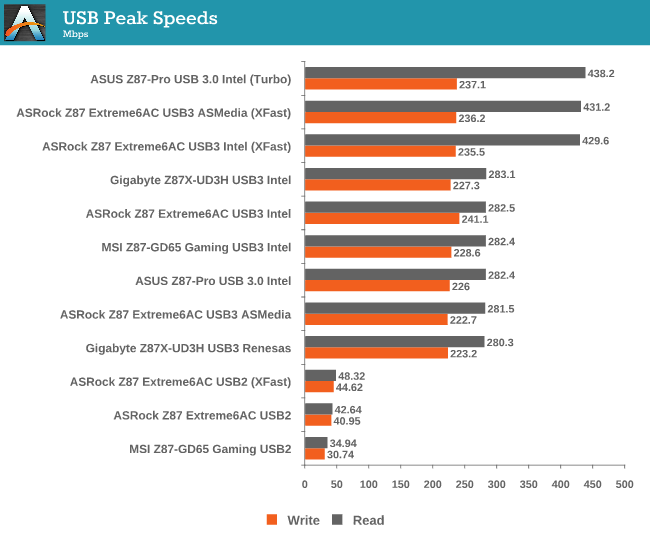
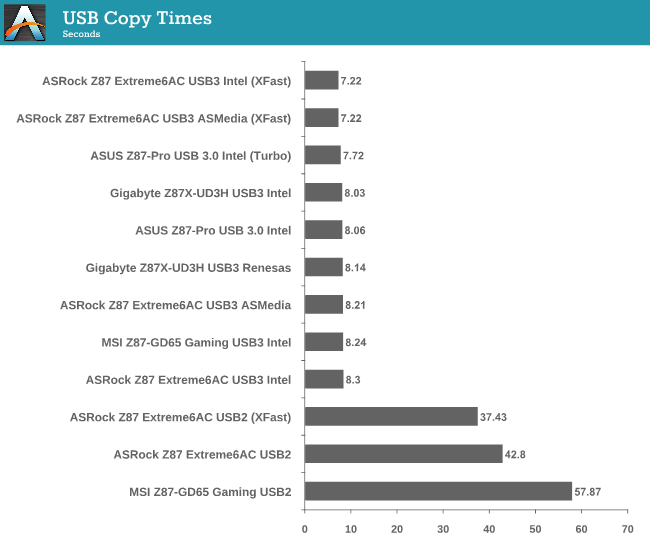
The ASRock motherboard with XFast produces some awesome numbers in terms of peak speeds and copy times, with the ASUS just behind. In USB 2.0, the ASRock has a good lead on the USB 2.0 rear IO ports over the MSI.
DPC Latency
Deferred Procedure Call latency is a way in which Windows handles interrupt servicing. In order to wait for a processor to acknowledge the request, the system will queue all interrupt requests by priority. Critical interrupts will be handled as soon as possible, whereas lesser priority requests, such as audio, will be further down the line. So if the audio device requires data, it will have to wait until the request is processed before the buffer is filled. If the device drivers of higher priority components in a system are poorly implemented, this can cause delays in request scheduling and process time, resulting in an empty audio buffer – this leads to characteristic audible pauses, pops and clicks. Having a bigger buffer and correctly implemented system drivers obviously helps in this regard. The DPC latency checker measures how much time is processing DPCs from driver invocation – the lower the value will result in better audio transfer at smaller buffer sizes. Results are measured in microseconds and taken as the peak latency while cycling through a series of short HD videos - less than 500 microseconds usually gets the green light, but the lower the better.
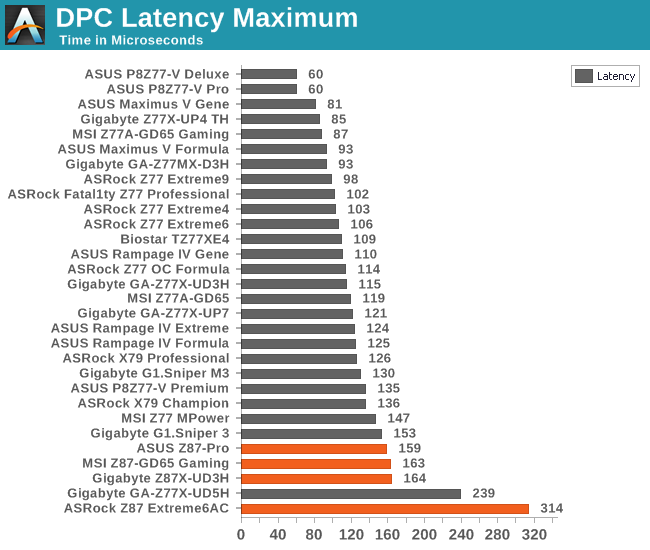
Unfortunately it seems that the DPC Latency of Haswell is greater than that of Ivy Bridge, at least for release. DPC is all down to how aggressive the manufacturer wants to tune the BIOS, and this should improve over time.
WiFi Speeds
With the advent of 802.11ac now part of the motherboard space, it made sense to bring in hardware to test the wireless capabilities of the packages we review. Our test scenario is as follows – the router is located five meters away from the test bed and the signal has to travel through a concrete internal wall. The router is in a flat complex with over 25 access points within 50 meters, mostly on 2.4 GHz. We use a LAN Speed Test server on an i3-3225 based system connected via Ethernet to the D-Link 802.11ac router and then the LAN Speed Test client on the host machine. We set up a one hour continuous test using 10 simultaneous streams each sending then receiving 50 MB across the connection. Results are then plotted as a histogram of the data.

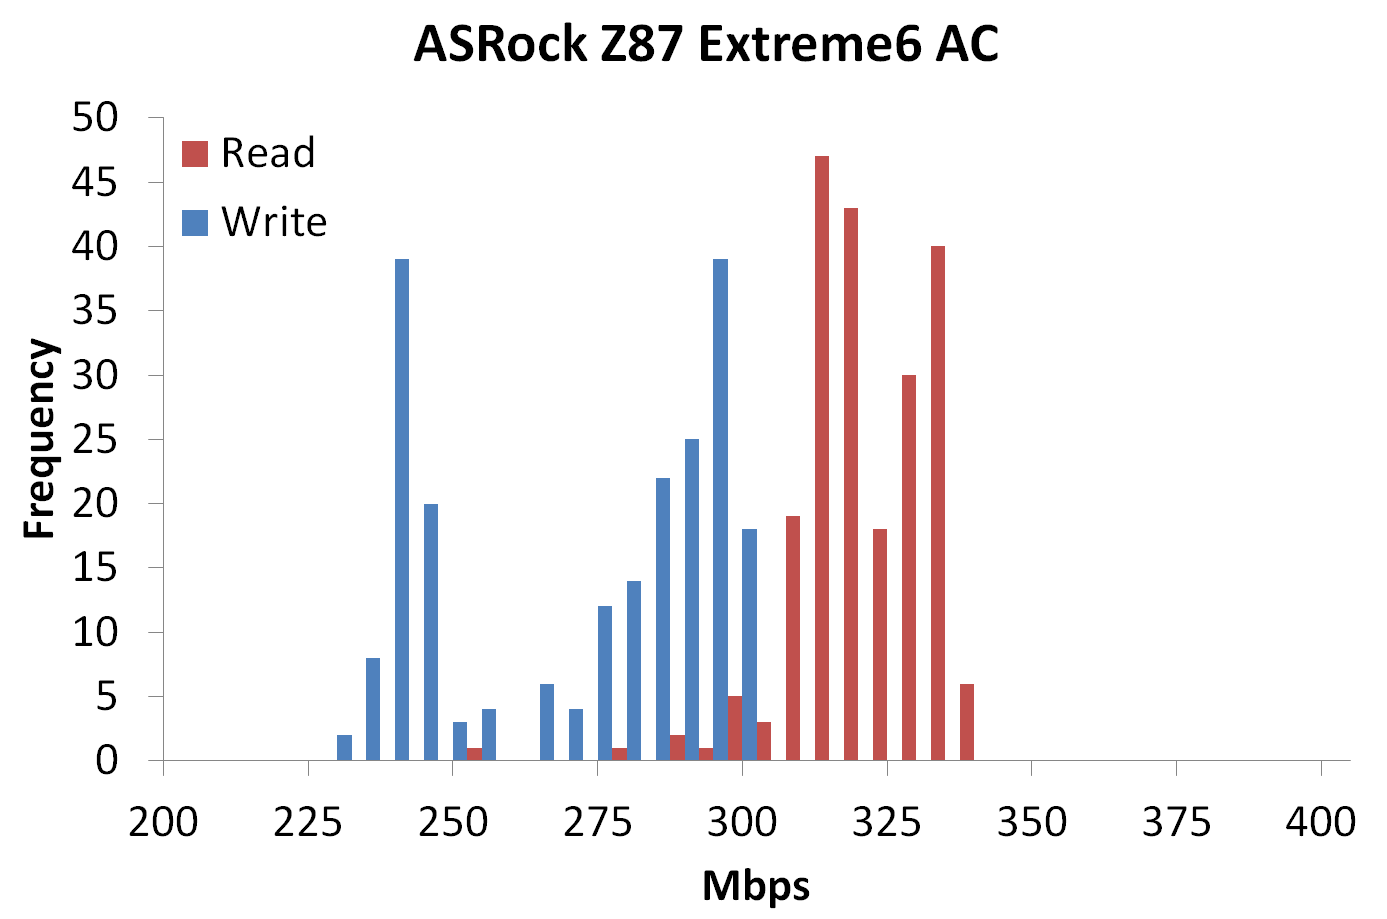
The benefits of AC lead to another 100-150 Mbps over 802.11n in our testing scenario. AC results also seem a little more varied rather than 802.11n which has definite singular peaks.


58 Comments
View All Comments
ShieTar - Thursday, June 27, 2013 - link
Is there a special reason not to test the POST times and DPC latency of the Gigabyte Board? Its power consumption is quiet impressive, and whatever design measures have been used to achieve it do not seem to negatively affect the overall performance. So it would be interesting to complete the picture with the two measurements which are missing.IanCutress - Thursday, June 27, 2013 - link
DPC Latency on the Gigabyte during testing was jumping around a fair bit, hitting 800+, though that is more likely due to the early BIOS revision. I need to run the POST test (as the results are strangely missing from my database) as well as the DPC test on a newer BIOS. Since I started testing almost every manufacturer has released newer BIOSes (as is always the way coming up to a launch) and I really have to lay the hammer down as testing a whole new BIOS takes a good 30 hours or so start to finish, so when I'm locked in that's it. That in a way does give an unfair advantage to the board I test last, but there's not a lot else I can do. I am still getting emails of BIOS updates for these boards as of yesterday.Ian
tribbles - Thursday, June 27, 2013 - link
Am I wrong in thinking that Gigabyte hasn't been doing well in the DPC Latency Test since Z77? If so, that's kind of surprising, since Gigabyte seems to be a "go-to" brand for digital audio workstation builders.IanCutress - Wednesday, July 10, 2013 - link
I retested the UD3H on the F5 (public) BIOS, and it scored 164. The two next boards I have in for review got 160 and 157, which points fingers to the DPC on Haswell being 150+ regardless of motherboard. This might be a fundamental issue.Timur Born - Saturday, July 27, 2013 - link
Run Prime95 (or turn off CPU power features) while measuring DPC latencies to see how much CPU power saving features affect DPCs.jhonabundance - Thursday, August 28, 2014 - link
great share http://asus.comjhonabundance - Thursday, August 28, 2014 - link
this is the best share http://asus.comRick83 - Thursday, June 27, 2013 - link
Maybe a bad choice to use two different ways of graphing the Rightmark results.Being consistent with regard to cutting off the irrelevant bit of the graph makes it a much easier read.
Now it appears at first glance as though the Gigabyte board is much better in THD+N, simply because the differences were so minuscule in the dynamic range bit.
On another note: Shouldn't it be more interesting to use a standardized input instead of the input of the board? In the current protocol a good output could be handicapped by a bad input, and conversely. For most users the output is much more important than the input, so it might be better to test it independently? I would recommend using a USB soundcard as an easy means of doing this test on the same machine, without changing the setup protocol too much.
And finally - I seem to remember Rightmark results for earlier reviews - it would be interesting to have those (or maybe a reference soundcard?) as comparison in the same graph. After all, for DPC you maintain a large cross-platform table as well.
Nice thorough initial review, those nitpicks withstanding.
IanCutress - Thursday, June 27, 2013 - link
Unfortunately I can't adjust the engine to represent from 0 for negative values, I don't have access to the low level options. I forwarded it on as an issue.I'd love to use a standardized input with RMAA. I guess it would be good to get a sound card with an input that supercedes the output of the motherboard and put it through that way, and hopefully there won't be a driver conflict along the line. I'll see what I can do to get in the hardware for that, although many soundcards are designed more for output and the input dynamic range/distortion might be the limiting factor as is the case on motherboards. Something like the Xonar Essence STX has a 118 dBA input with -113 dBA THD+N which might be a good starting point.
Our RMAA testing for Z87 has changed a little from Z77 to make it more of an efficiency test rather than an out-the-box test as audio is such a varied playing field. RMAA is very sensitive to certain windows settings and volumes for example such that with the right combination it was very easy to show A>B or B>A depending on how the OS felt it should be set up. The new testing regimen for RMAA should iron out those issues but the results are not exactly comparable to Z77 for that reason. There are so many wrong ways to set up RMAA it can be difficult (and a learning experience) to get it right.
Ian
popej - Thursday, June 27, 2013 - link
Nice to see you are planning steps in right direction. Using reference card for measurements is a proper solution. Be aware, that separate card add complications to the test, for example you will have to take care about ground loops and signal level matching. Professional card with balanced input could help a lot.