Intel Z87 Motherboard Review with Haswell: Gigabyte, MSI, ASRock and ASUS
by Ian Cutress on June 27, 2013 8:00 AM EST- Posted in
- Motherboards
- Intel
- MSI
- Gigabyte
- ASRock
- Asus
- Haswell
- Z87
- Shark Bay
- Lynx Point
Many thanks to...
We must thank the following companies for kindly providing hardware for our test bed:
Thank you to OCZ for providing us with 1250W Gold Power Supplies.
Thank you to G.Skill for providing us with memory kits.
Thank you to Corsair for providing us with an AX1200i PSU, Corsair H80i CLC and 16GB 2400C10 memory.
Thank you to ASUS for providing us with the AMD GPUs and some IO Testing kit.
Thank you to ECS for providing us with the NVIDIA GPUs.
Thank you to Rosewill for providing us with the 500W Platinum Power Supply for mITX testing, BlackHawk Ultra, and 1600W Hercules PSU for extreme dual CPU + quad GPU testing, and RK-9100 keyboards.
Thank you to ASRock for providing us with the 802.11ac wireless router for testing.
Test Setup
| Test Setup | |
| Processor |
Intel Core i7-4770K Retail 4 Cores, 8 Threads, 3.5 GHz (3.9 GHz Turbo) |
| Motherboards |
ASRock Z87 Extreme6/AC ASUS Z87-Pro Gigabyte Z87X-UD3H MSI Z77A-GD65 Gaming |
| Cooling |
Corsair H80i Thermaltake TRUE Copper |
| Power Supply |
OCZ 1250W Gold ZX Series Corsair AX1200i Platinum PSU |
| Memory |
GSkill TridentX 4x4 GB DDR3-2400 10-12-12 Kit Corsair Vengeance Pro 2x8 GB DDR3 2400 10-12-12 Kit |
| Memory Settings | XMP (2400 10-12-12) |
| Video Cards |
ASUS HD7970 3GB ECS GTX 580 1536MB |
| Video Drivers |
Catalyst 13.1 NVIDIA Drivers 310.90 WHQL |
| Hard Drive | OCZ Vertex 3 256GB |
| Optical Drive | LG GH22NS50 |
| Case | Open Test Bed |
| Operating System | Windows 7 64-bit |
| USB 2/3 Testing | OCZ Vertex 3 240GB with SATA->USB Adaptor |
| WiFi Testing | D-Link DIR-865L 802.11ac Dual Band Router |
Power Consumption
Power consumption was tested on the system as a whole with a wall meter connected to the OCZ 1250W power supply, while in a dual 7970 GPU configuration. This power supply is Gold rated, and as I am in the UK on a 230-240 V supply, leads to ~75% efficiency > 50W, and 90%+ efficiency at 250W, which is suitable for both idle and multi-GPU loading. This method of power reading allows us to compare the power management of the UEFI and the board to supply components with power under load, and includes typical PSU losses due to efficiency. These are the real world values that consumers may expect from a typical system (minus the monitor) using this motherboard.
While this method for power measurement may not be ideal, and you feel these numbers are not representative due to the high wattage power supply being used (we use the same PSU to remain consistent over a series of reviews, and the fact that some boards on our test bed get tested with three or four high powered GPUs), the important point to take away is the relationship between the numbers. These boards are all under the same conditions, and thus the differences between them should be easy to spot.
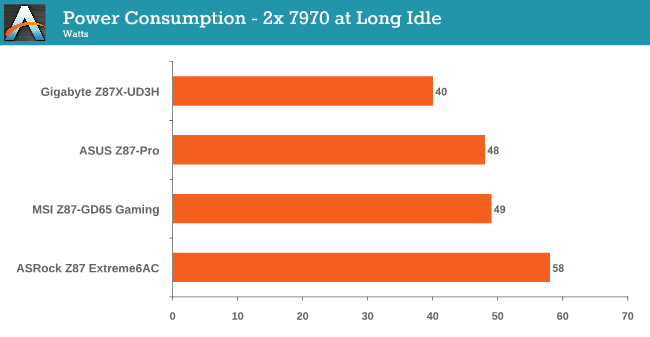
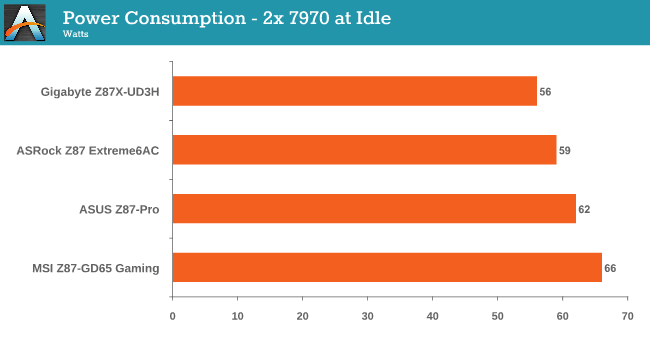
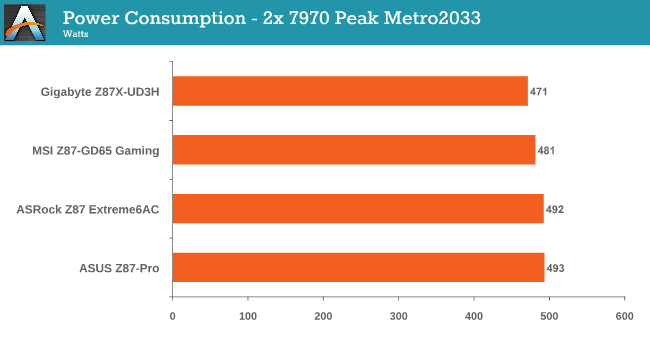
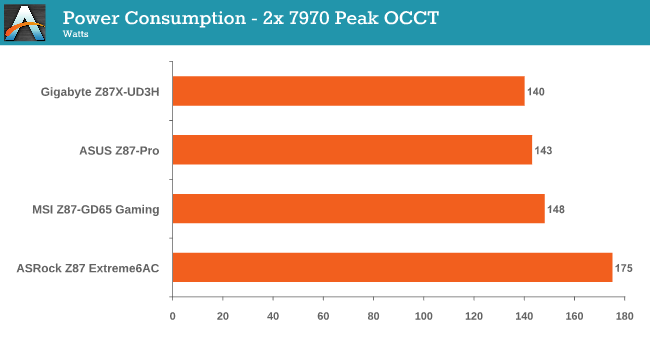
In terms of power consumption in our roundup, the Gigabyte Z87X-UD3H takes the crown in all factors, with Idle and Long Idle being 10-20W lower than the ASRock. All boards get under 500W during Metro.
Windows 7 POST Time
Different motherboards have different POST sequences before an operating system is initialized. A lot of this is dependent on the board itself, and POST boot time is determined by the controllers on board (and the sequence of how those extras are organized). As part of our testing, we are now going to look at the POST Boot Time - this is the time from pressing the ON button on the computer to when Windows 7 starts loading. (We discount Windows loading as it is highly variable given Windows specific features.) These results are subject to human error, so please allow +/- 1 second in these results.
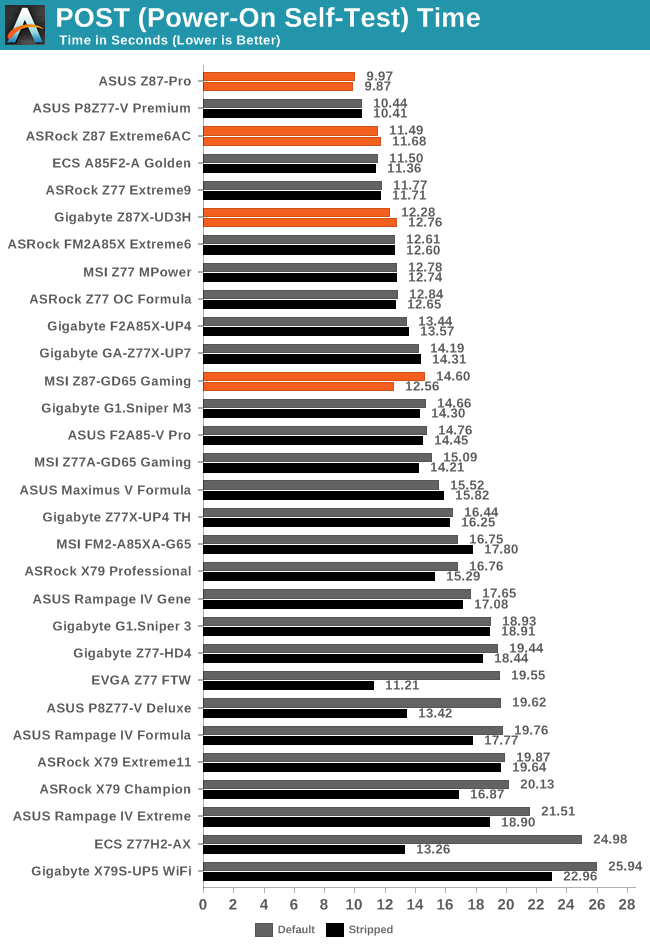
The ASUS Z87-Pro sneaks in at under 10 seconds which is a great achievement, with the ASRock under 12 seconds. The Gigabyte almost hits that 12 second ideal line, whereas the MSI BIOS has to be stripped of all controllers to get near the Gigabyte. Overall boot times seem to be better than Ivy Bridge, however.


58 Comments
View All Comments
ShieTar - Thursday, June 27, 2013 - link
Is there a special reason not to test the POST times and DPC latency of the Gigabyte Board? Its power consumption is quiet impressive, and whatever design measures have been used to achieve it do not seem to negatively affect the overall performance. So it would be interesting to complete the picture with the two measurements which are missing.IanCutress - Thursday, June 27, 2013 - link
DPC Latency on the Gigabyte during testing was jumping around a fair bit, hitting 800+, though that is more likely due to the early BIOS revision. I need to run the POST test (as the results are strangely missing from my database) as well as the DPC test on a newer BIOS. Since I started testing almost every manufacturer has released newer BIOSes (as is always the way coming up to a launch) and I really have to lay the hammer down as testing a whole new BIOS takes a good 30 hours or so start to finish, so when I'm locked in that's it. That in a way does give an unfair advantage to the board I test last, but there's not a lot else I can do. I am still getting emails of BIOS updates for these boards as of yesterday.Ian
tribbles - Thursday, June 27, 2013 - link
Am I wrong in thinking that Gigabyte hasn't been doing well in the DPC Latency Test since Z77? If so, that's kind of surprising, since Gigabyte seems to be a "go-to" brand for digital audio workstation builders.IanCutress - Wednesday, July 10, 2013 - link
I retested the UD3H on the F5 (public) BIOS, and it scored 164. The two next boards I have in for review got 160 and 157, which points fingers to the DPC on Haswell being 150+ regardless of motherboard. This might be a fundamental issue.Timur Born - Saturday, July 27, 2013 - link
Run Prime95 (or turn off CPU power features) while measuring DPC latencies to see how much CPU power saving features affect DPCs.jhonabundance - Thursday, August 28, 2014 - link
great share http://asus.comjhonabundance - Thursday, August 28, 2014 - link
this is the best share http://asus.comRick83 - Thursday, June 27, 2013 - link
Maybe a bad choice to use two different ways of graphing the Rightmark results.Being consistent with regard to cutting off the irrelevant bit of the graph makes it a much easier read.
Now it appears at first glance as though the Gigabyte board is much better in THD+N, simply because the differences were so minuscule in the dynamic range bit.
On another note: Shouldn't it be more interesting to use a standardized input instead of the input of the board? In the current protocol a good output could be handicapped by a bad input, and conversely. For most users the output is much more important than the input, so it might be better to test it independently? I would recommend using a USB soundcard as an easy means of doing this test on the same machine, without changing the setup protocol too much.
And finally - I seem to remember Rightmark results for earlier reviews - it would be interesting to have those (or maybe a reference soundcard?) as comparison in the same graph. After all, for DPC you maintain a large cross-platform table as well.
Nice thorough initial review, those nitpicks withstanding.
IanCutress - Thursday, June 27, 2013 - link
Unfortunately I can't adjust the engine to represent from 0 for negative values, I don't have access to the low level options. I forwarded it on as an issue.I'd love to use a standardized input with RMAA. I guess it would be good to get a sound card with an input that supercedes the output of the motherboard and put it through that way, and hopefully there won't be a driver conflict along the line. I'll see what I can do to get in the hardware for that, although many soundcards are designed more for output and the input dynamic range/distortion might be the limiting factor as is the case on motherboards. Something like the Xonar Essence STX has a 118 dBA input with -113 dBA THD+N which might be a good starting point.
Our RMAA testing for Z87 has changed a little from Z77 to make it more of an efficiency test rather than an out-the-box test as audio is such a varied playing field. RMAA is very sensitive to certain windows settings and volumes for example such that with the right combination it was very easy to show A>B or B>A depending on how the OS felt it should be set up. The new testing regimen for RMAA should iron out those issues but the results are not exactly comparable to Z77 for that reason. There are so many wrong ways to set up RMAA it can be difficult (and a learning experience) to get it right.
Ian
popej - Thursday, June 27, 2013 - link
Nice to see you are planning steps in right direction. Using reference card for measurements is a proper solution. Be aware, that separate card add complications to the test, for example you will have to take care about ground loops and signal level matching. Professional card with balanced input could help a lot.