Kingston SSDNow V300 (120GB & 240GB) Review
by Kristian Vättö on April 30, 2013 12:30 PM ESTAnandTech Storage Bench 2011
Two years ago we introduced our AnandTech Storage Bench, a suite of benchmarks that took traces of real OS/application usage and played them back in a repeatable manner. Anand assembled the traces out of frustration with the majority of what we have today in terms of SSD benchmarks.
Although the AnandTech Storage Bench tests did a good job of characterizing SSD performance, they weren't stressful enough. All of the tests performed less than 10GB of reads/writes and typically involved only 4GB of writes specifically. That's not even enough exceed the spare area on most SSDs. Most canned SSD benchmarks don't even come close to writing a single gigabyte of data, but that doesn't mean that simply writing 4GB is acceptable.
Originally we kept the benchmarks short enough that they wouldn't be a burden to run (~30 minutes) but long enough that they were representative of what a power user might do with their system. Later, however, we created what we refer to as the Mother of All SSD Benchmarks (MOASB). Rather than only writing 4GB of data to the drive, this benchmark writes 106.32GB. This represents the load you'd put on a drive after nearly two weeks of constant usage. And it takes a long time to run.
1) The MOASB, officially called AnandTech Storage Bench 2011—Heavy Workload, mainly focuses on the times when your I/O activity is the highest. There is a lot of downloading and application installing that happens during the course of this test. Our thinking was that it's during application installs, file copies, downloading, and multitasking with all of this that you can really notice performance differences between drives.
2) We tried to cover as many bases as possible with the software incorporated into this test. There's a lot of photo editing in Photoshop, HTML editing in Dreamweaver, web browsing, game playing/level loading (Starcraft II and WoW are both a part of the test), as well as general use stuff (application installing, virus scanning). We included a large amount of email downloading, document creation, and editing as well. To top it all off we even use Visual Studio 2008 to build Chromium during the test.
The test has 2,168,893 read operations and 1,783,447 write operations. The IO breakdown is as follows:
| AnandTech Storage Bench 2011—Heavy Workload IO Breakdown | ||||
| IO Size | % of Total | |||
| 4KB | 28% | |||
| 16KB | 10% | |||
| 32KB | 10% | |||
| 64KB | 4% | |||
Only 42% of all operations are sequential; the rest ranges from pseudo to fully random (with most falling in the pseudo-random category). Average queue depth is 4.625 IOs, with 59% of operations taking place in an IO queue of 1.
Many of you have asked for a better way to really characterize performance. Simply looking at IOPS doesn't really say much. As a result we're going to be presenting Storage Bench 2011 data in a slightly different way. We'll have performance represented as Average MB/s, with higher numbers being better. At the same time we'll be reporting how long the SSD was busy while running this test. These disk busy graphs will show you exactly how much time was shaved off by using a faster drive vs. a slower one during the course of this test. Finally, we will also break out performance into reads, writes, and combined. The reason we do this is to help balance out the fact that this test is unusually write intensive, which can often hide the benefits of a drive with good read performance.
There's also a new light workload for 2011. This is a far more reasonable, typical every day use case benchmark. It has lots of web browsing, photo editing (but with a greater focus on photo consumption), video playback, as well as some application installs and gaming. This test isn't nearly as write intensive as the MOASB but it's still multiple times more write intensive than what we were running last year.
We don't believe that these two benchmarks alone are enough to characterize the performance of a drive, but hopefully along with the rest of our tests they will help provide a better idea. The testbed for Storage Bench 2011 has changed as well. We're now using a Sandy Bridge platform with full 6Gbps support for these tests.
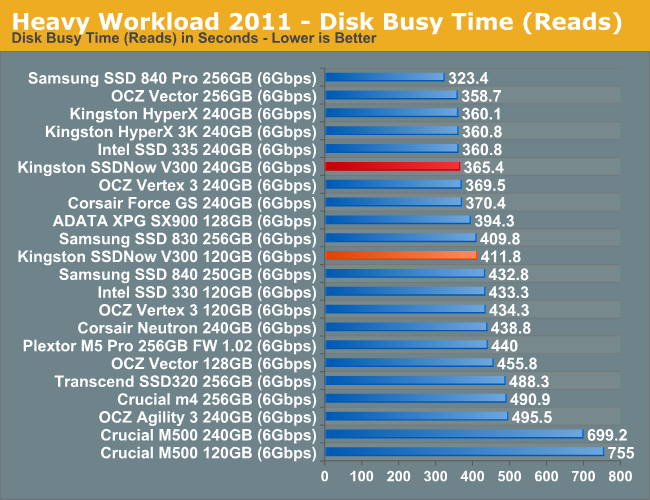
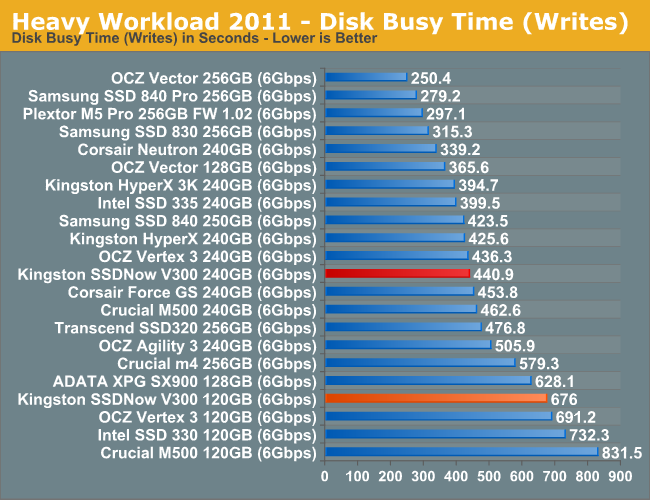
AnandTech Storage Bench 2011—Heavy Workload
We'll start out by looking at average data rate throughout our heavy workload test:
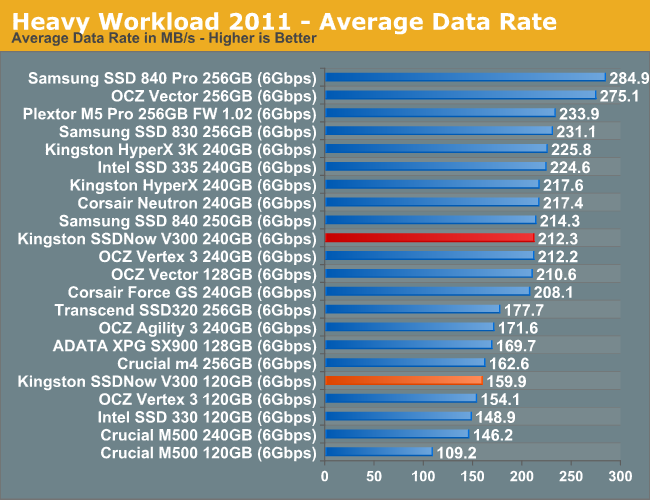
Our Heavy suite also shows that the V300 performs similarly to most SandForce based SSDs. The HyperX is slightly faster but if you're looking for the fastest SSD, then Samsung SSD 840 Pro or OCZ Vector is your best choice.


43 Comments
View All Comments
blackmagnum - Tuesday, April 30, 2013 - link
Kingston have the brand image to succeed in this market but their product lack the unique selling point. They are just commodities like their ram sticks.Kristian Vättö - Tuesday, April 30, 2013 - link
Which is exactly the point I was trying to raise. Kingston has a decent image and their distribution system is broad but their products are not unique. They shouldn't have a problem surviving in the market but they won't be able to grab any major marketshare either.UltraTech79 - Tuesday, April 30, 2013 - link
I don't think their goal is to grab major market share. Its to maintain and secure their current market share.Diagrafeas - Tuesday, April 30, 2013 - link
Which firmware did the drives have?I bought two 120GB ones a week apart.
The first has 505 and the second 506.
The 506 is way slower...even at booting Windows.
I'll post some numbers later...
Kristian Vättö - Tuesday, April 30, 2013 - link
The 120GB I have is 505. I don't have the 240GB anymore but I'm pretty confident it's 505 too as I received it a couple of months ago so it's not exactly new.Diagrafeas - Thursday, May 2, 2013 - link
Both are on SATA 2AS SSD Benchmark Scores 505-506(Read,Write)
Seq256-175 , 158-133
4K 14-11 , 45-26
4K-64
Diagrafeas - Thursday, May 2, 2013 - link
4K-64 123-91 , 109-114Acc. Time 0.138-0.195 , 0.321-0.405
Pyrostemplar - Tuesday, April 30, 2013 - link
On the second table - Kingston SSDNow V300 Specifications - performance drops as capacity increases, something that being correct is completely new in terms of SSDs. AFAIK in every SSD the higher capacity ones have the same or greater performance than lower capacity ones (of the same model, of course). C&P mistake?Kristian Vättö - Tuesday, April 30, 2013 - link
Nope, it's not a mistake (unless Kingston's datasheet is wrong):http://www.kingston.com/datasheets/sv300s3_us.pdf
mike55 - Tuesday, April 30, 2013 - link
The images on page 3 aren't working for me.Is there any significant difference in the msachi drivers compared to intel rst? Is it worth installing the intel ones when using an SSD?