Plextor M5M (256GB) mSATA Review
by Kristian Vättö on April 17, 2013 10:20 AM ESTAnandTech Storage Bench 2011
Two years ago we introduced our AnandTech Storage Bench, a suite of benchmarks that took traces of real OS/application usage and played them back in a repeatable manner. Anand assembled the traces out of frustration with the majority of what we have today in terms of SSD benchmarks.
Although the AnandTech Storage Bench tests did a good job of characterizing SSD performance, they weren't stressful enough. All of the tests performed less than 10GB of reads/writes and typically involved only 4GB of writes specifically. That's not even enough exceed the spare area on most SSDs. Most canned SSD benchmarks don't even come close to writing a single gigabyte of data, but that doesn't mean that simply writing 4GB is acceptable.
Originally we kept the benchmarks short enough that they wouldn't be a burden to run (~30 minutes) but long enough that they were representative of what a power user might do with their system. Later, however, we created what we refer to as the Mother of All SSD Benchmarks (MOASB). Rather than only writing 4GB of data to the drive, this benchmark writes 106.32GB. This represents the load you'd put on a drive after nearly two weeks of constant usage. And it takes a long time to run.
1) The MOASB, officially called AnandTech Storage Bench 2011—Heavy Workload, mainly focuses on the times when your I/O activity is the highest. There is a lot of downloading and application installing that happens during the course of this test. Our thinking was that it's during application installs, file copies, downloading, and multitasking with all of this that you can really notice performance differences between drives.
2) We tried to cover as many bases as possible with the software incorporated into this test. There's a lot of photo editing in Photoshop, HTML editing in Dreamweaver, web browsing, game playing/level loading (Starcraft II and WoW are both a part of the test), as well as general use stuff (application installing, virus scanning). We included a large amount of email downloading, document creation, and editing as well. To top it all off we even use Visual Studio 2008 to build Chromium during the test.
The test has 2,168,893 read operations and 1,783,447 write operations. The IO breakdown is as follows:
| AnandTech Storage Bench 2011—Heavy Workload IO Breakdown | ||||
| IO Size | % of Total | |||
| 4KB | 28% | |||
| 16KB | 10% | |||
| 32KB | 10% | |||
| 64KB | 4% | |||
Only 42% of all operations are sequential; the rest ranges from pseudo to fully random (with most falling in the pseudo-random category). Average queue depth is 4.625 IOs, with 59% of operations taking place in an IO queue of 1.
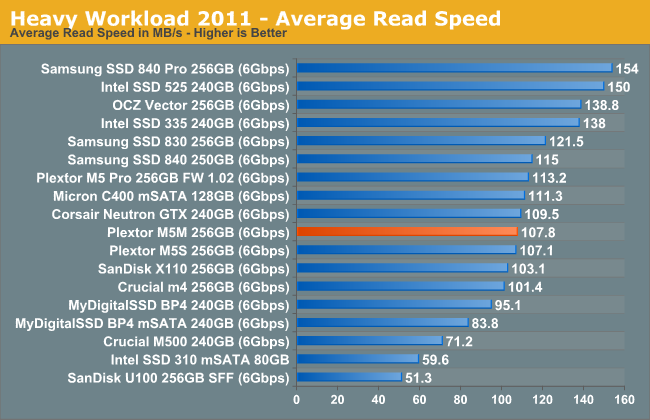
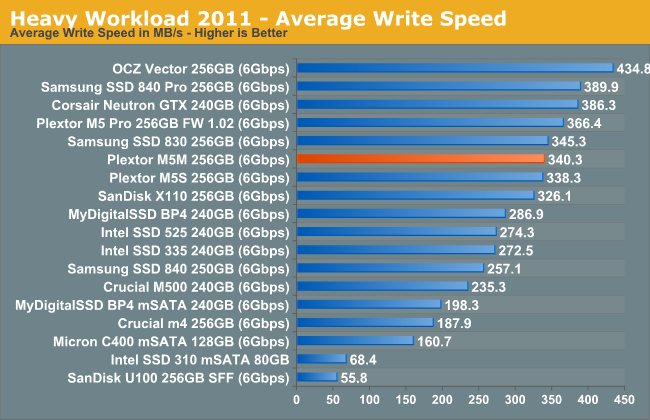
Many of you have asked for a better way to really characterize performance. Simply looking at IOPS doesn't really say much. As a result we're going to be presenting Storage Bench 2011 data in a slightly different way. We'll have performance represented as Average MB/s, with higher numbers being better. At the same time we'll be reporting how long the SSD was busy while running this test. These disk busy graphs will show you exactly how much time was shaved off by using a faster drive vs. a slower one during the course of this test. Finally, we will also break out performance into reads, writes, and combined. The reason we do this is to help balance out the fact that this test is unusually write intensive, which can often hide the benefits of a drive with good read performance.
There's also a new light workload for 2011. This is a far more reasonable, typical every day use case benchmark. It has lots of web browsing, photo editing (but with a greater focus on photo consumption), video playback, as well as some application installs and gaming. This test isn't nearly as write intensive as the MOASB but it's still multiple times more write intensive than what we were running last year.
We don't believe that these two benchmarks alone are enough to characterize the performance of a drive, but hopefully along with the rest of our tests they will help provide a better idea. The testbed for Storage Bench 2011 has changed as well. We're now using a Sandy Bridge platform with full 6Gbps support for these tests.
AnandTech Storage Bench 2011—Heavy Workload
We'll start out by looking at average data rate throughout our heavy workload test:
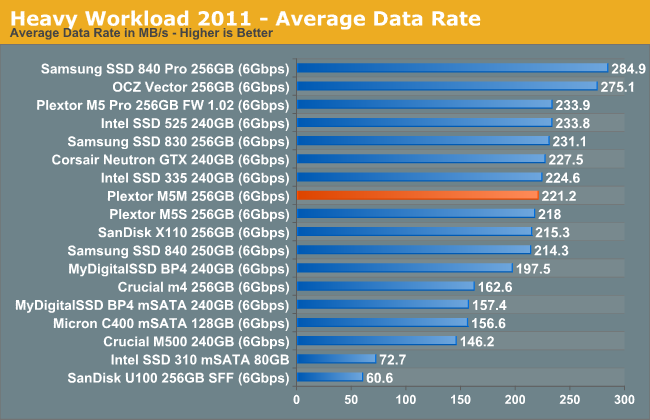
The M5 Pro is able to pull a small lead in our Heavy suite, but the difference is a mere 4%. The difference comes from M5 Pro's higher write speeds, though that was expected since the M5M is limited in terms of NAND bandwidth.
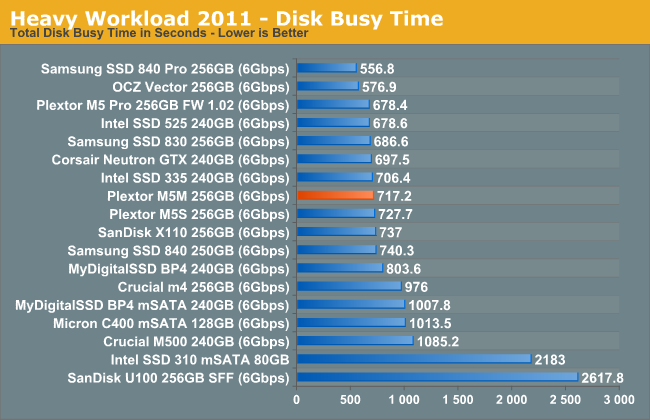
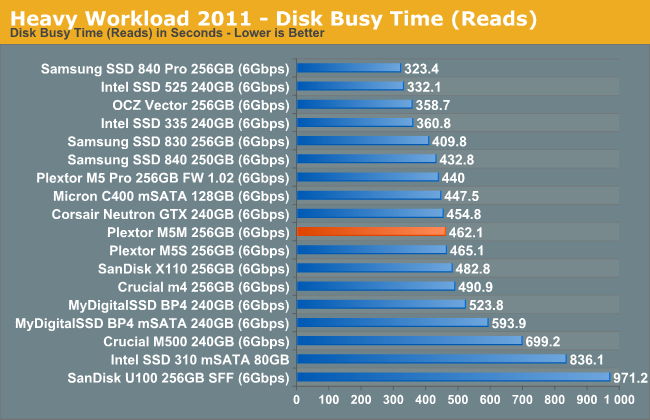
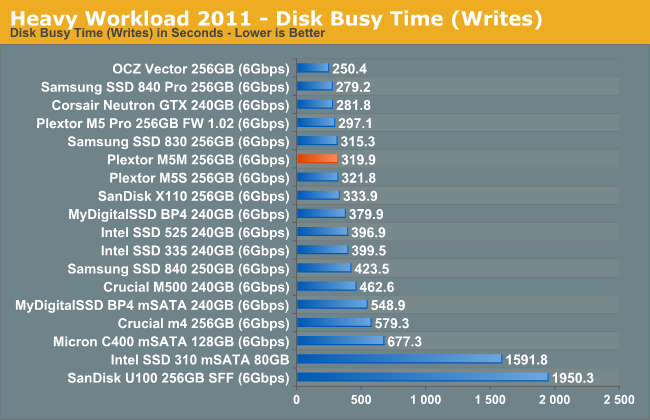
The next three charts just represent the same data, but in a different manner. Instead of looking at average data rate, we're looking at how long the disk was busy for during this entire test. Note that disk busy time excludes any and all idles, this is just how long the SSD was busy doing something:


36 Comments
View All Comments
kmmatney - Wednesday, April 17, 2013 - link
" I strongly recommend having at least 25% free space with the M5M. The more you fill the drive, the more likely it is that you'll face inconsistent performance."Would this really effect the average user? Do you let the drives idle long enough so the normal garbage collection can kick in?
msahni - Wednesday, April 17, 2013 - link
Hi there,First of all Kristian thanks for the reviews. You've finally answered my queries about the best mSATA SSD to get. (from the Intel 525 review)
Could you please advise what is the best method to leave the 25% free space on the drive for over provisioning to enhance the performance.
Cheers....
Minion4Hire - Wednesday, April 17, 2013 - link
Anand answered that in another article. I believe you are supposed to shrink the partition, create a second partition out of the unallocated space, then delete the new partition. The act of deleting the partition brings the OS to TRIM that portion of the drive freeing it up for use as spare area. And since you won't be writing to it any more it is permanently spare area (well, unless you repartition or something)xdrol - Wednesday, April 17, 2013 - link
Actually, Windows does not trim when you delete a partition, rather when you create a new one.Hrel - Wednesday, April 17, 2013 - link
I have wondered for a long time if the extra free space is really necessary. Home users aren't benchmarking, drives are mostly idle. Not often do you transfer 100GB at a time or install programs.JellyRoll - Wednesday, April 17, 2013 - link
Unrealistic workloads for a consumer environment result in unrealistic test results. How many consumer notebooks or laptops, hell even enterprise mobile devices, will be subjected to this type of load? Answer: Zero.Even in a consumer desktop this is NEVER going to happen.
JPForums - Thursday, April 18, 2013 - link
It was stated a long time ago at Anandtech that their testing was harsher than typical consumer loads for the express purpose of separating the field. Under typical consumer workloads, there is practically no difference between modern drives. I don't know how many times I've read that any SSD is a significant step up from an HDD. It has pretty much been a standing assumption since the old jMicron controllers left the market. However, more information is required for those that need (or think they need) the performance to handle heavier workloads.Personally, everything else being equal, I'd rather have the drive that performs better/more consistently, even if it is only in workloads I never see. I don't think Kristian is trying to pull the wool over your eyes. He simply gives the readers here enough credit to make up their own mind about the level of performance they need.
Kristian Vättö - Wednesday, April 17, 2013 - link
If the drive is nearly full and there's no extra OP, then it's possible that even normal (but slightly larger/heavier, like app installation) usage will cause the performance to become inconsistent which will affect the overall performance (average IOPS will go down). Performance will of course recover with idle time but the hit in performance has already been experienced.JellyRoll - Wednesday, April 17, 2013 - link
Running a simple trace of an application install will show that this is not an accurate statement. This testing also does not benefit from TRIM because there is no filesystem during the test. This ends up making an overly-negative portrayal.JPForums - Thursday, April 18, 2013 - link
Which test in particular are you referring to that has no access to TRIM, that otherwise would?As far as application traces go, I can confirm Kristian's statement is accurate on both a Corsair Force GT 120GB and a Crucial M4 128GB. Performance drops appreciably when installing programs with a large number of small files (or copying a large number of small files I.E. Libraries). As an aside, it can also tank the performance of Xilinx ISE, which is typically limited by memory bandwidth and single threaded CPU performance.