OCZ Agility 4 (256GB) Review
by Kristian Vättö on September 1, 2012 1:00 PM ESTRandom Read/Write Speed
The four corners of SSD performance are as follows: random read, random write, sequential read and sequential write speed. Random accesses are generally small in size, while sequential accesses tend to be larger and thus we have the four Iometer tests we use in all of our reviews. Our first test writes 4KB in a completely random pattern over an 8GB space of the drive to simulate the sort of random access that you'd see on an OS drive (even this is more stressful than a normal desktop user would see).
We perform three concurrent IOs and run the test for 3 minutes. The results reported are in average MB/s over the entire time. We use both standard pseudo randomly generated data for each write as well as fully random data to show you both the maximum and minimum performance offered by SandForce based drives in these tests. The average performance of SF drives will likely be somewhere in between the two values for each drive you see in the graphs. For an understanding of why this matters, read our original SandForce article.
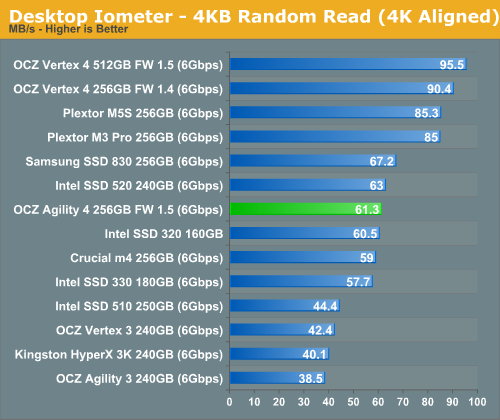
The performance difference between synchronous and asynchronous NAND is pretty clear here. At queue depth of 1, 4KB random reads are heavily dependent on the speed of NAND. Queue depth of 1 means that only one I/O request is sent at a time, which means the controller can only read from one NAND at a time (write combining helps work around this issue). Increasing queue depth allows the controller to read from multiple NAND dies at the same time, which leads to better performance especially when dealing with slower NAND (you can always hide latency with parallelism). Our 4KB random read test happens at queue depth of 3, which gives the Agility 4 some breathing room but it's still enough to show the difference between asynchronous and synchronous NAND.
Note that with bigger transfers, this is not as big issue because they are usually broken into smaller pieces and striped across multiple NAND dies, again allowing the controller to utilize multiple NAND dies simultaneously. Obviously, you need a fast controller and firmware to really notice the impact of slower NAND, which is exactly what the Everest 2 is.
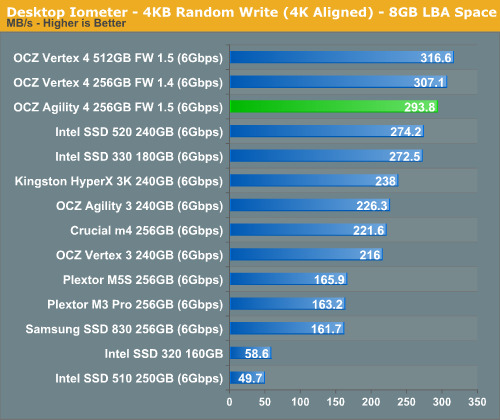
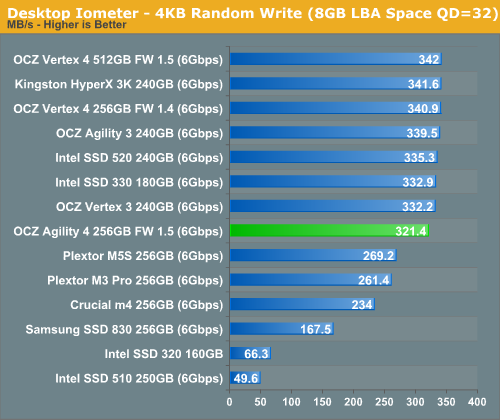
Random write performance isn't impacted as much by the slower NAND, not even at queue depth of 1. When reading data from an SSD, the data has to be fetched from the actual NAND, which can create a bottleneck with slower NAND. Write IOs, on the other hand, can be cached to much faster DRAM before written to NAND. Today's SSDs have fairly big caches so the NAND will have plenty of time to catch up. Of course, ultimately you will hit a wall and the NAND becomes a bottleneck. After our 20 minute torture session (4KB random writes at queue depth of 32 and 100% LBA space ran on a full drive), the Agility 4 was writing at 19.1MB/s, while 256GB Vertex 4 was chugging along at 28.4MB/s.
Sequential Read/Write Speed
To measure sequential performance we ran a one minute long 128KB sequential test over the entire span of the drive at a queue depth of 1. The results reported are in average MB/s over the entire test length.
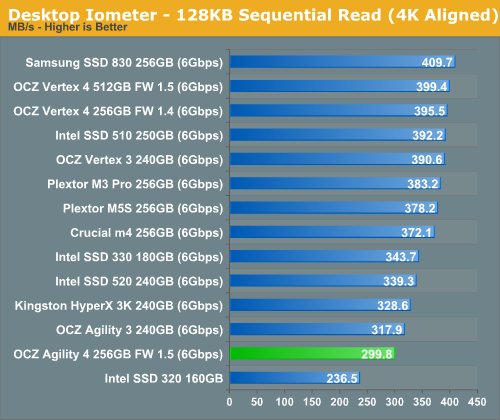
Sequential read performance is slower compared to Vertex 4 so we are definitely being limited by NAND here.
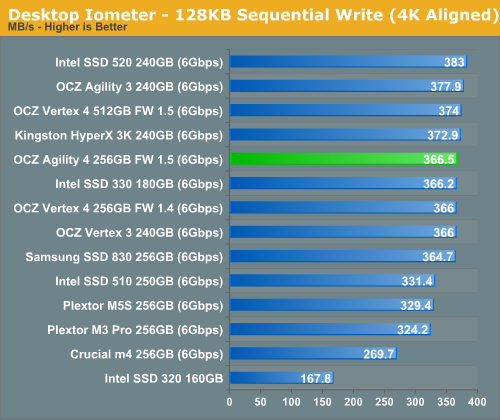
Sequential write speed is in fact on-par with Vertex 4. The bottleneck is obviously something else than NAND because quite a few drives are hitting the same speeds. We're likely running into the limits of how much parallelism you can extract from a low queue depth 128KB sequential transfer.


41 Comments
View All Comments
MadMan007 - Saturday, September 1, 2012 - link
Given that performance mode significantly affects HDTach, it might be useful to run some of the other broad tests like AnandTech Storage Bench with a drive that's more full. The results posted for that test may reflect the 'ideal' performance of a drive that isn't very full, and I can imagine most users would at least reach the second performance plateau with a drive that's actually being used to store OS and applications, if not the third tier. If so it could make quite a difference in the results.Alexvrb - Saturday, September 1, 2012 - link
I second this. Why would I buy a drive with more than twice the capacity I need, when the drives will just be outdated junk in a couple of years? I'd like to see the real-world performance of these SSDs after they've been filled over 50%.rs2 - Sunday, September 2, 2012 - link
Third.'Performance mode' is a hack and a gimmick. The drive suddenly loses 50% of its performance as soon as it 25% full. And then another 60% of what's left if you go past 80%. That's just absurd. While many users may well stay under the 80% capacity mark, very few will stay under 25% long-term.
Any benchmarks of this drive should be done at a minimum of 25% capacity to better reflect the real-world performance that most users will see.
semo - Monday, September 3, 2012 - link
This is your standard bait and switch sale tactic from OCZ but at least they are more upfront about it this time. When they swapped the innards of the Vertex 2 and completely changed the specs (both performance and capacity, for the worse) they never told anyone.Anand was even reluctant to report on this shifty marketing practices but eventually caved in, only to have OCZ say sorry and not issue a mass recall...
Craigster586 - Sunday, November 11, 2012 - link
My Vertex 3 120gb is around 75% capacity. After reading your post I ran a Disc Benchmark using the latest Pass Mark software. With 8 programs running and 4 downloads My overall result was 2296. with 220MB/s Read and 215 MB/s write. Taking into consideration I'm at about 3/4 capacity running 8 programs with multiple downloads. I think my SSD is Performing quite well. Im not gonna say I'm not lucky. These drives are known to crash I bought it knowingly But I've had mine since they been on the market and havn't had a single issue. However i did update my SSD's firmware to the latest edition again thats at your own risk but it worked for me with no issues.Craigster586 - Sunday, November 11, 2012 - link
Vertex 3 120Gb PassMark Disc Bench MarkDisk Mark
#1 - Seagate ST3300622AS (300GB) 456.4
#2 - WDC WD5000AAKS-00V1A0 (500GB) 580
#3 - Seagate ST31000528AS (1TB) 709
#4 - SAMSUNG MZ7PC064HADR-000 (64GB) 2846
#5 - SAMSUNG HD103SJ (1TB) 850
#6 - INTEL SSDSC2CW240A3 (240GB) 3434
This Computer 2296
Disk - Sequential Read
#1 - Seagate ST3300622AS (300GB) 62.0
#2 - WDC WD5000AAKS-00V1A0 (500GB) 78.4
#3 - Seagate ST31000528AS (1TB) 100.4
#4 - SAMSUNG MZ7PC064HADR-000 (64GB) 461.9
#5 - SAMSUNG HD103SJ (1TB) 118.5
#6 - INTEL SSDSC2CW240A3 (240GB) 393.6
This Computer 220.4
Disk - Sequential Write
#1 - Seagate ST3300622AS (300GB) 61.2
#2 - WDC WD5000AAKS-00V1A0 (500GB) 78.5
#3 - Seagate ST31000528AS (1TB) 90.9
#4 - SAMSUNG MZ7PC064HADR-000 (64GB) 155.4
#5 - SAMSUNG HD103SJ (1TB) 112.3
#6 - INTEL SSDSC2CW240A3 (240GB) 225.4
This Computer 216.8
Disk - Random Seek + RW
#1 - Seagate ST3300622AS (300GB) 2.94
#2 - WDC WD5000AAKS-00V1A0 (500GB) 3.58
#3 - Seagate ST31000528AS (1TB) 4.80
#4 - SAMSUNG MZ7PC064HADR-000 (64GB) 169.6
#5 - SAMSUNG HD103SJ (1TB) 4.13
#6 - INTEL SSDSC2CW240A3 (240GB) 330.6
This Computer 197.7
akumaburn - Tuesday, December 11, 2012 - link
That is true.. however..The drive recovers its performance afterwards. What they mean is that if you all the sudden wrote 120GB of data unto their 256GB drive the performance of your drive will drop to about half-this is normal. Give it a few hours of idle time, do a trim and reboot and you're back up to 100%.
I have a vertex 4 and can vouch for this, it does slow down, but if you give it a few hours for its internal space management to do its thing it will speed up again to near 100% performance.
LB-ID - Tuesday, September 4, 2012 - link
A fool and his money are soon parted, and anyone who buys an SSD from OCZ is a fool. They treat their customers like beta testers, and mock them when they have issues. No thanks, I'll stick to far more reliable products from far more reliable companies.ashrafi - Saturday, September 1, 2012 - link
Nice article ,at the end ,
"agility 4 for significantly less than the Crucial m4 of Samsung SSD 830 "
little correction
"agility 4 for significantly less than the Crucial m4 or Samsung SSD 830 "
Kristian Vättö - Saturday, September 1, 2012 - link
Fixed! Thanks for the heads up :-)