Corsair Neutron GTX SSD Review (240GB): Link A Media Controller Tested
by Anand Lal Shimpi on August 20, 2012 6:00 AM EST- Posted in
- Storage
- SSDs
- Corsair
- Neutron
- Link a Media
Random Read/Write Speed
The four corners of SSD performance are as follows: random read, random write, sequential read and sequential write speed. Random accesses are generally small in size, while sequential accesses tend to be larger and thus we have the four Iometer tests we use in all of our reviews.
Our first test writes 4KB in a completely random pattern over an 8GB space of the drive to simulate the sort of random access that you'd see on an OS drive (even this is more stressful than a normal desktop user would see). I perform three concurrent IOs and run the test for 3 minutes. The results reported are in average MB/s over the entire time. We use both standard pseudo randomly generated data for each write as well as fully random data to show you both the maximum and minimum performance offered by SandForce based drives in these tests. The average performance of SF drives will likely be somewhere in between the two values for each drive you see in the graphs. For an understanding of why this matters, read our original SandForce article.
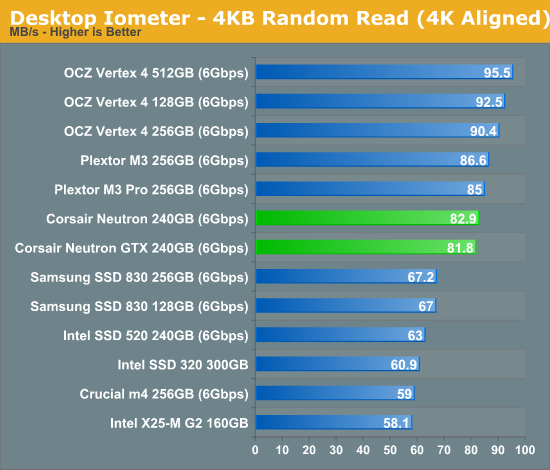
The Neutron GTX gets off to a good start. Random read performance is faster than Samsung's SSD 830 as well as any Intel drive, although it does fall behind OCZ's Vertex 4. There's virtually no difference between the Neutron and Neutron GTX here.
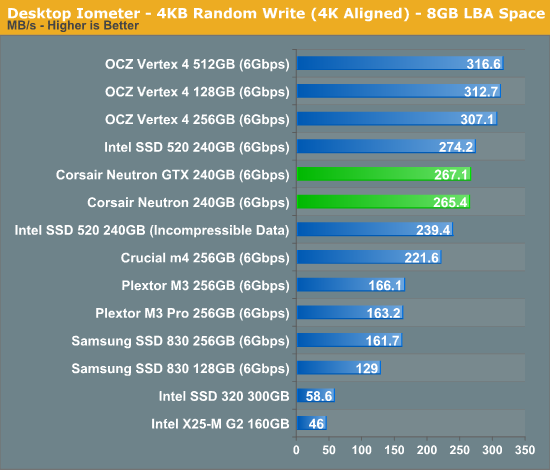
Random write performance is similarly impressive , once again beating almost every drive with the exception of the Vertex 4. The Neutron and Neutron GTX tie once again.
Many of you have asked for random write performance at higher queue depths. What I have below is our 4KB random write test performed at a queue depth of 32 instead of 3. While the vast majority of desktop usage models experience queue depths of 0 - 5, higher depths are possible in heavy I/O (and multi-user) workloads:
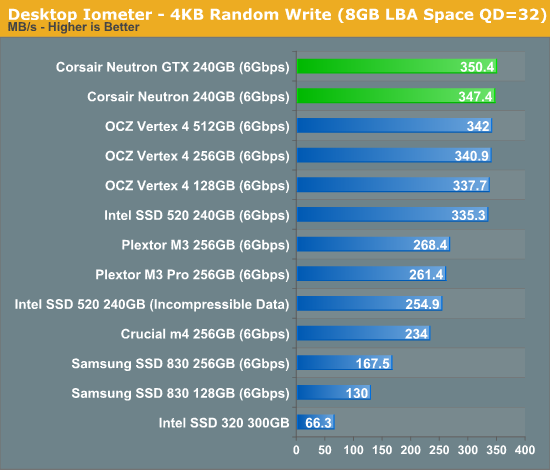
Crank up the queue depth and the Neutron GTX rises to the top. The regular Neutron delivers similar performance. These drives are potent...
Sequential Read/Write Speed
To measure sequential performance I ran a 1 minute long 128KB sequential test over the entire span of the drive at a queue depth of 1. The results reported are in average MB/s over the entire test length.
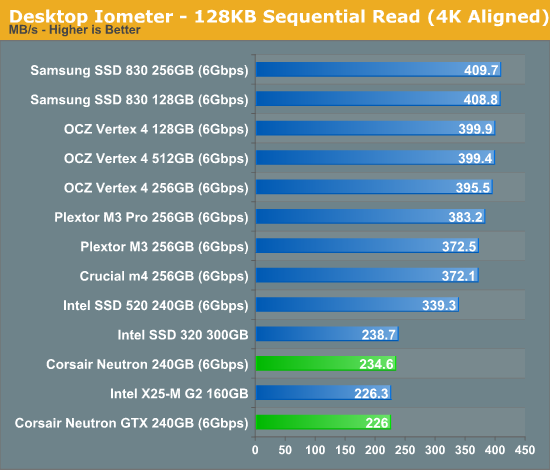
Low queue depth sequential read performance has been an issue for a couple of drives as of late. The original Vertex 4 firmware delivered disappointing results here, and the Neutron GTX is no different. We're seeing distinctly 2010 levels of performance here. LAMD didn't prioritize low queue depth sequential read performance as it's not typically a first order limit to real world performance.
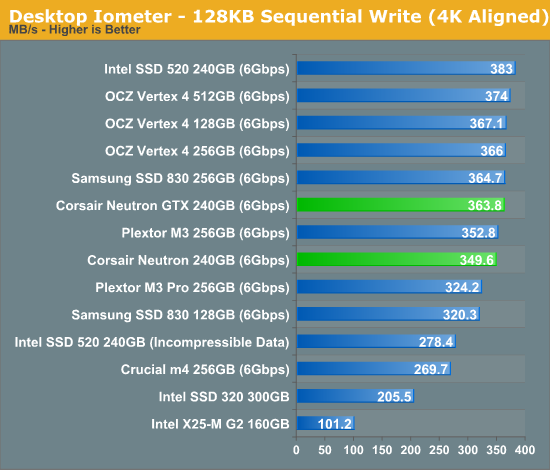
Low queue depth sequential write performance is good however. I'm really curious to see why we've seen the same initial tradeoff for low queue depth sequential read performance made by both OCZ and Link A Media.
This is also the first test where we see a difference in performance between the Neutron and Neutron GTX. The latter is 4% faster.
AS-SSD Incompressible Sequential Performance
The AS-SSD sequential benchmark uses incompressible data for all of its transfers. The result is a pretty big reduction in sequential write speed on SandForce based controllers.
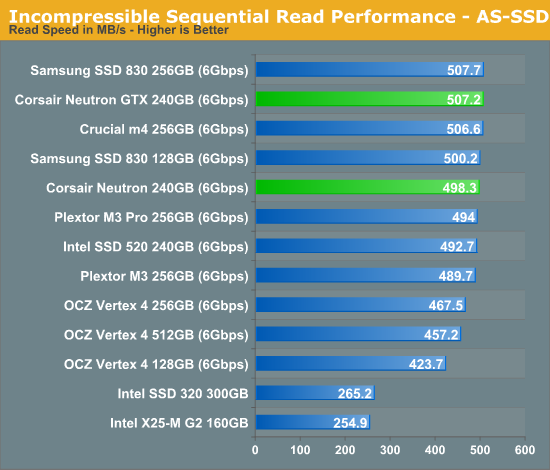
AS-SSD ramps up queue depth and here we see the Neutron GTX return to its former, competitive state. Here the Neutron GTX is among the fastest drives we've tested, and effectively maxes out the 6Gbps SATA interface.
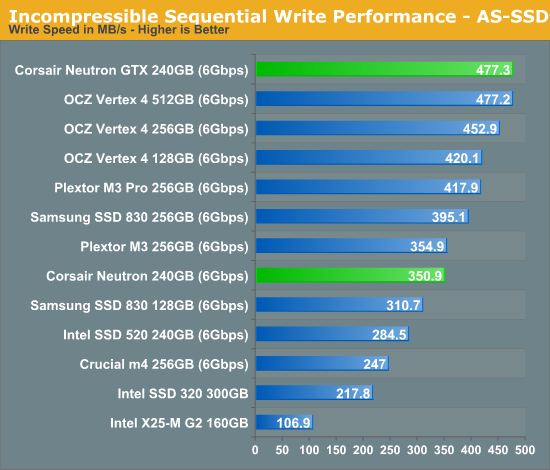
Once again it's all good news here from Corsair. The Neutron GTX performs extremely well. The vanilla Neutron however isn't nearly as impressive. At only 350.9MB/s the standard Neutron is around the speed of the Plextor M3. There's really no reason for this performance gap, I can only assume that the ONFi firmware just isn't as well tuned as the Toggle version.
Performance vs. Transfer Size
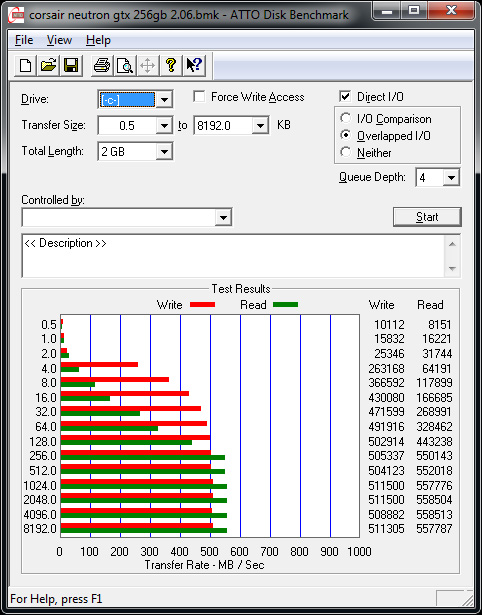
ATTO is a useful tool for quickly measuring the impact of transfer size on performance. In order to focus on areas of noticeable difference I cropped out the larger transfer sizes. You can get the complete data set in Bench or for the Neutron GTX in particular you can just check out the ATTO graph above. The charts below compare the Neutron/Neutron GTX to three of the leading SSD controllers: Indilinx's Everest 2 (OCZ Vertex 4), Samsung's PM830 (Samsung SSD 830) and SandForce's SF-2281 (Intel SSD 520). Let's start with read performance:

Although SandForce's performance scales quite linearly, it's actually Samsung that aggressively drives performance even at smaller transfer sizes. Both the Everest 2 and LAMD's LM87800 controller aren't nearly as well optimized for smaller transfer sizes, with the LAMD controller doing a little worse. Note that both the Neutron and Neutron GTX scale almost identically across transfer sizes.
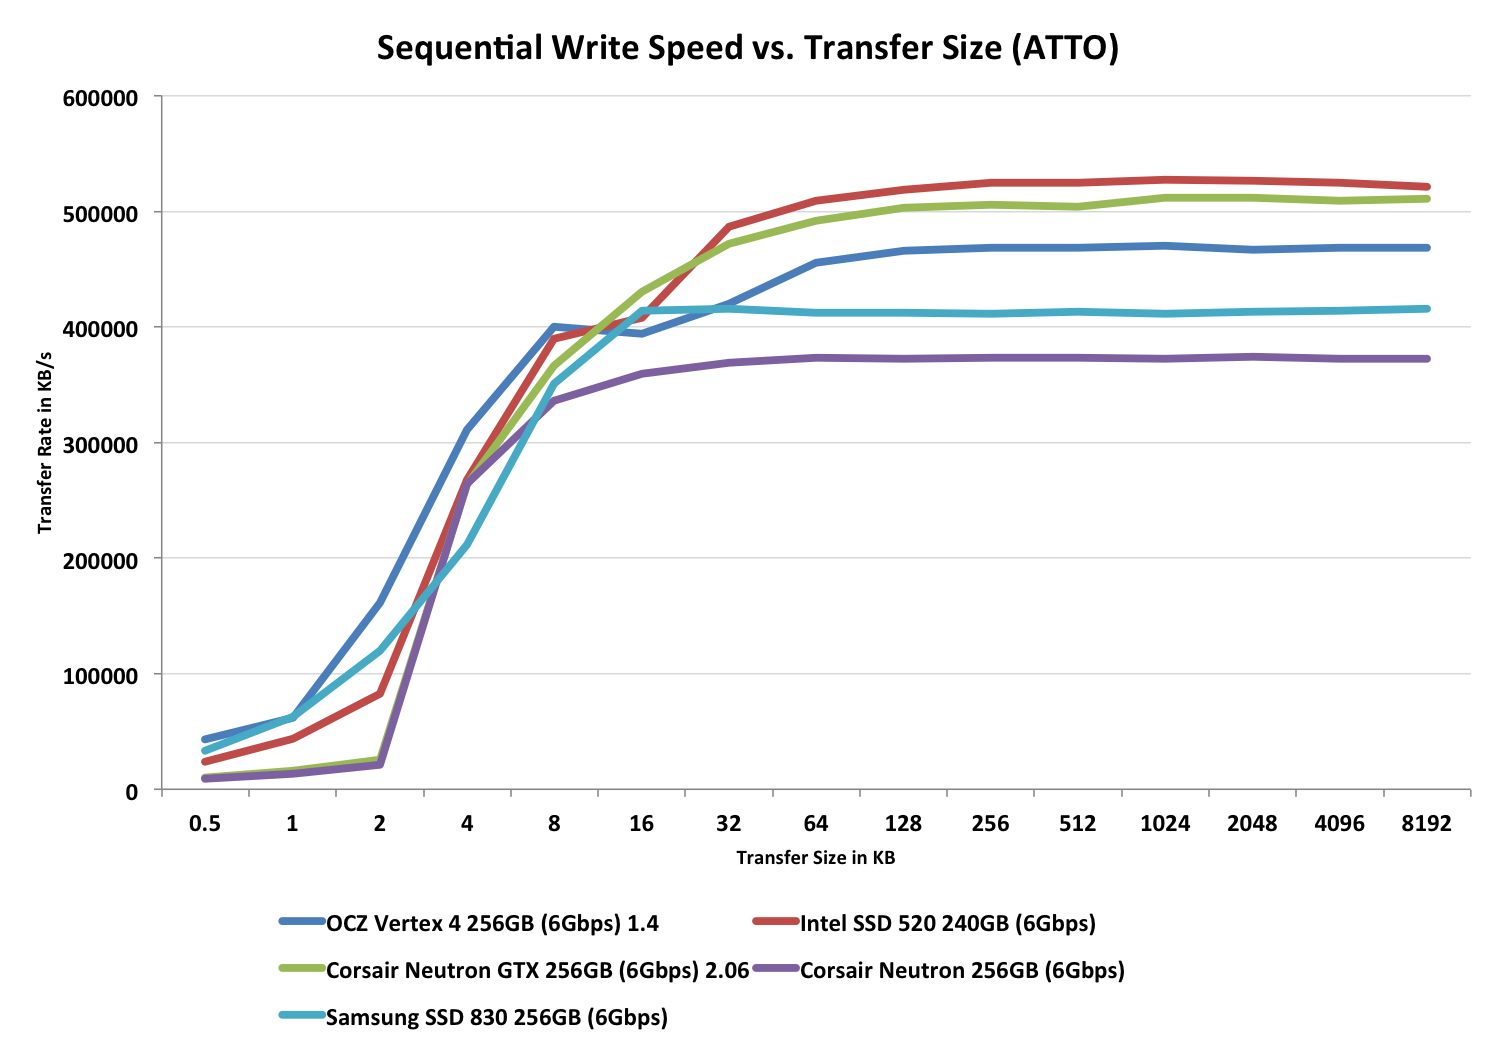
The problem is even more pronounced when we look at write performance. Here there's a significant performance limit at sequential transfer sizes below 4KB. The good news is these limitations don't surface in most consumer workloads, but it's still worth pointing out one of the only limitations of the Neutron GTX's current controller/firmware combination.
We also see the big gap in sequential write speed form between the Neutron and Neutron GTX. The two perform quite similarly up to 8KB transfer sizes, beyond that the Neutron GTX holds a healthy advantage.


36 Comments
View All Comments
wsjudd - Monday, August 20, 2012 - link
Looks like there's a stray bit of punctuation in here:"The drive is the Neutron, and the controller maker? Link A Media Devices"
AnotherGuy - Monday, August 20, 2012 - link
Really after so much information in the article... thats what you have to say... the Punctuation?I am afraid people wanna see some relevant thoughts and opinions about the info on the article not ur stupid comments on punctuation. These articles are about technology not your English 101 u take at school.
Really tired of the same comments on almost every article.
gmallen - Monday, August 20, 2012 - link
They certainly don't want to see inane, off-topic troll-bait like your comment. If you're so distressed by these comments, don't read them or comment about them. Get a life instead.AnotherGuy - Monday, August 20, 2012 - link
when he or others who post same comments see my insane comment, they might realize that they are actually annoying and stop doing it.Mr. Pedantic - Monday, August 20, 2012 - link
We can only hope you will recognise the same thing and stop posting useless rubbish.seapeople - Monday, August 20, 2012 - link
Not to feed the trolls, but I agree with this troll somewhat. The proposed punctuation correction wasn't even necessarily correct.Rishi100 - Monday, August 20, 2012 - link
Let it be so.... attractive, that I jump on my second SSD.Bmadd89 - Monday, August 20, 2012 - link
On page 1 you comment saying the DRAM in the Neutron is 256MB but in the graph its 128MBXZerg - Monday, August 20, 2012 - link
I would really suggest that you keep the contenders consistent across all the benches/tests. It just feels wrong to see Product X in few benches and then missing in other, point in case OCZ products missing in the power consumption. I am sure that you have their numbers but for some reason those are skipped.mayankleoboy1 - Monday, August 20, 2012 - link
with many controllers tying at ~ 500MBPS, are we reaching the theoretical speeds of NAND flash? Meaning controllers can get better, but speeds wont increase much?What are the theoretical speeds of NAND flash?