A Look at Enterprise Performance of Intel SSDs
by Anand Lal Shimpi on February 8, 2012 6:36 PM EST- Posted in
- Storage
- IT Computing
- SSDs
- Intel
Measuring How Long Your Intel SSD Will Last
Earlier in this review I talked about Intel's SMART attributes that allow you to accurately measure write amplification for a given workload. If you fire up Intel's SSD Toolbox or any tool that allows you to monitor SMART attributes you'll notice a few fields of interest. I mentioned these back in our 710 review, but the most important for our investigations here are E2 (226) and E4 (228):
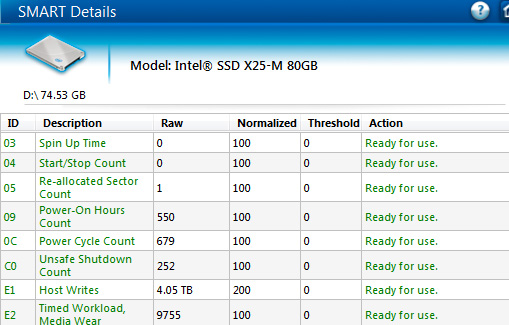
The raw value of attribute E2, when divided by 1024, gives you an accurate report of the amount of wear on your NAND since the last timer reset. In this case we're looking at an Intel X25-M G2 (the earliest drive to support E2 reporting) whose E2 value is at 9755. Dividing that by 1024 gives us 9.526% (the field is only accurate to three decimal points).
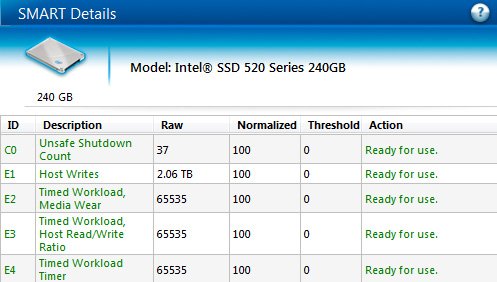
I mentioned that this data is only accurate since the last timer reset, that's where the value stored in E4 comes into play. By executing a SMART EXECUTE OFFLINE IMMEDIATE subcommand 40h to the drive you'll reset the timer in E4 and the data stored in E2 and E3. The data in E2/E3 will then reflect the wear incurred since you reset the timer, giving you a great way of measuring write amplification for a specific workload.
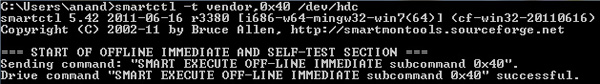
How do you reset the E4 timer? I've always used smartmontools to do it. Download the appropriate binary from sourceforge and execute the following command:
smartctl -t vendor,0x40 /dev/hdX where X is the drive whose counter you're trying to reset (e.g. hda, hdb, hdc, etc...).
Doing so will reset the E4 counter to 65535. The counter then begins at 0 and will count up in minutes. After the first 60 minutes you'll get valid data in E2/E3. While E2 gives you an indication of how much wear your workload puts on the NAND, E3 gives you the percentage of IO operations that are reads since you reset E4. E3 is particularly useful for determining how write heavy your workload is at a quick glance. Remember, it's the process of programing/erasing a NAND cell that is most destructive - read heavy workloads are generally fine on consumer grade drives.
I reset the workload timer (E4) on all of the Intel SSDs that supported it and ran a loop of our MS SQL Weekly Maintenance benchmark that resulted in 320GB of writes to the drive. I then measured wear on the NAND (E2) and used that to calculate how many TBs we could write to these drives, using this workload, before we'd theoretically wear out their NAND. The results are below:
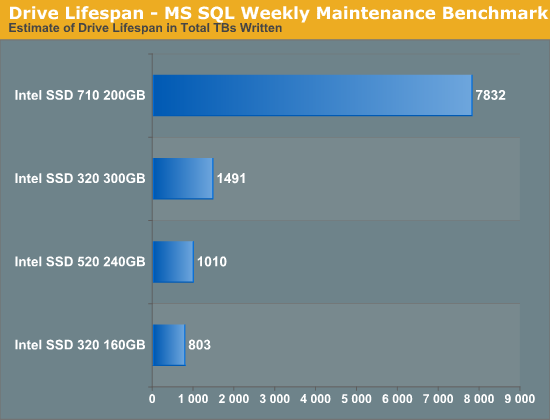
There are a few interesting takeaways from this data. For starters, Intel's SSD 710 uses high endurance MLC (aka eMLC, MLC-HET) which is good for a significant increase in p/e cycles. With tens of thousands of p/e cycles per NAND cell, the Intel SSD 710 offers nearly an order of magnitude better endurance than the Intel SSD 320. Part of this endurance advantage is delivered through an incredible amount of spare area. Remember that although the 710 featured here is a 200GB drive it actually has 320GB of NAND on board. If you set aside a similar amount of spare area on the 320 you'd get a measurable increase in endurance. We actually see an example of that if you look at the gains the 300GB SSD 320 offers over the 160GB drive. Both drives are subjected to the same sized workload (just under 60GB), but the 300GB drive has much more unused area to use for block recycling. The result is an 85% increase in estimated drive lifespan for an 87.5% increase in drive capacity.
What does this tell us for how long these drives would last? If all they were doing was running this workload once a week, even the 160GB SSD 320 would be just fine. In reality our SQL server does far more than this but even then we'd likely be ok with a consumer drive. Note that the 800TBs of writes for the 160GB 320 is well above the 15TB Intel rates the drive for. The difference here is that Intel is calculating lifespan based on 4KB random writes with a very high write amplification. If we work backwards from these numbers for the MLC drives you'll end up with around 4000 - 5000 p/e cycles. In reality, even 25nm Intel NAND lasts longer than what it's rated for so what you're seeing is that this workload has a very low write amplification on these drives thanks to its access pattern and small size relative to the capacity of these drives.
Every workload is going to be different but what may have been a brutal consumer of IOs in the past may still be right at home on consumer SSDs in your server.


55 Comments
View All Comments
jeremyshaw - Wednesday, February 8, 2012 - link
woah... I've been waiting for an article like this for a long time.Thank you Anandtech!
ckryan - Wednesday, February 8, 2012 - link
Is AnandTech ever planning on doing a longer period SSD test? A long term testing scenario would make for interesting reading.Anand Lal Shimpi - Wednesday, February 8, 2012 - link
Technically all of our SSD tests are long term. We're still testing Vertex 2 class drives and I actually still have six Intel X25-M G1s deployed in systems in my lab alone. You only hear about them when things go wrong. Most of the time I feed errors back to the vendors to get fixes put into firmware updates. The fact that you aren't seeing more of this sort of stuff means that things are working well :-PBut the results of our long term tests directly impact our reviews/recommendations. It's one of the reasons I've been so positive on the Samsung SSD 830 lately. I've been using 830s 24/7 since our review published in September with very good results :)
Take care,
Anand
Samus - Thursday, February 9, 2012 - link
I've had an X25-M G1 in my Macbook since 2009, used daily, never a problem. Lack of trim support doesn't really seem to matter unless you're the type the writes/deletes a lot of data.jwilliams4200 - Wednesday, February 8, 2012 - link
Since you found that the 520 does not really do any better than the 320 for endurance, does this also imply that the Sandforce controller was not able to achieve significant compression on the workload that you fed to it? In other words, Sandforce compression does not work very well on real data as opposed to artificial benchmark data.ckryan - Wednesday, February 8, 2012 - link
SF is really good at compressing fake data. I suppose some logs could really benefit, but one of my personal SF drives has 10% more raw writes than host writes. I suspect I'm not alone with this either.People doing repeated incompressible benches could have WA higher than 1 with SF, but once you install the OS and and programs, every day writes are less compressible than promised it would seem.
Anand Lal Shimpi - Wednesday, February 8, 2012 - link
Keep in mind that only 10% more NAND writes than host writes is *really* good. It's not uncommon to get much, much higher than that with other controllers.We did an 8 month study on SF drives internally. The highest write amp we saw was 0.7x. On my personal drive I saw a write amp of around 0.6x.
Take care,
Anand
jwilliams4200 - Thursday, February 9, 2012 - link
Baloney!You just saw a write amplification of near 1 on this very article. Why do you dodge my question?
erple2 - Thursday, February 9, 2012 - link
I suspect that the workloads that they were testing for with the SF drives internally are not what is reflected in this article.That implies, then, that the SF drives have been doing other workloads like acting in desktops and/or laptop duties. For those kinds of things, I suspect that a 0.6-0.7x is more reasonable (assuming there isn't much reading/writing of incompressible data).
Given that some of the workload may be for mobile applications, and given a strong focus on WDE for laptops, I wonder how that ultimately impacts the write amplification for drives with WDE on them.
jwilliams4200 - Thursday, February 9, 2012 - link
The "8 month study" that he refers to is very hard to believe.Does he really expect us to believe that the people in Anand's test lab used these SSDs for 8 months and did not run any benchmarks on them?
Most benchmarks write easily compressible data, and a lot of it.
The real way to test the Sandforce compression is to write typical user data to the SSD and monitor the raw write and host write attributes. That experiment has already been done on xtremesystems.org, and the findings were that typical user data bare compresses at all -- at best raw writes were 90% of host writes, but for most data it was 100% or higher. The only thing that got some compression was the OS and application installs, and most people only do those once, so it should not be counted towards user data when estimating endurance.