NVIDIA's GeForce GTX 560 Ti: Upsetting The $250 Market
by Ryan Smith on January 25, 2011 9:00 AM ESTCompute & Tessellation
Moving on from our look at gaming performance, we have our customary look at compute performance, bundled with a look at theoretical tessellation performance. Unlike our gaming benchmarks where NVIDIA’s architectural differences between GF114 and GF110 are largely irrelevant, they can become much more important under a compute-bound situation depending on just how much ILP can be extracted for the GTX 560 Ti.
Our first compute benchmark comes from Civilization V, which uses DirectCompute to decompress textures on the fly. Civ V includes a sub-benchmark that exclusively tests the speed of their texture decompression algorithm by repeatedly decompressing the textures required for one of the game’s leader scenes.
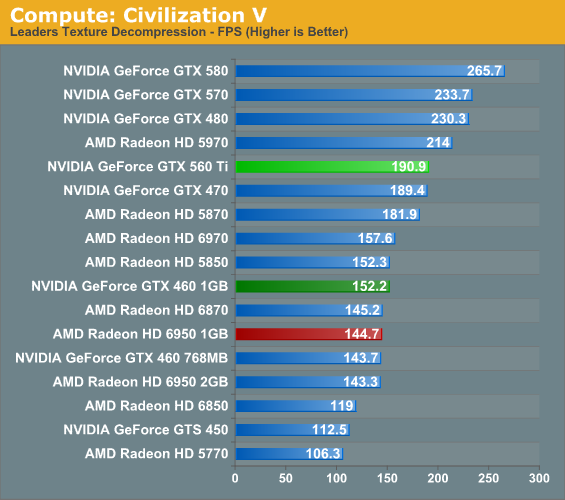
Under our Civilization 5 compute benchmark we have a couple of different things going on even when we just look at the NVIDIA cards. Compared to the GTX 460 1GB, the GTX 560 enjoys a 31% performance advantage; this is less than the theoretical maximum of 39%, but not far off from the performance advantages we’ve seen in most games. Meanwhile the GTX 470 is practically tied with the GTX 560 even though on paper the GTX 560 has around a 15% theoretical performance advantage. This ends up being a solid case of where the limitations of ILP come in to play, as clearly the GTX 560 isn’t maximizing the use of its superscalar shaders. Or to put it another way, it’s an example as to why NVIDIA isn’t using a superscalar design on their Tesla products.
Meanwhile this benchmark has always favored NVIDIA’s architectures, so in comparison to AMD’s cards there’s little to be surprised about. The GTX 560 Ti is well in the lead, with the only AMD card it can’t pass being the dual-GPU 5970.
Our second GPU compute benchmark is SmallLuxGPU, the GPU ray tracing branch of the open source LuxRender renderer. While it’s still in beta, SmallLuxGPU recently hit a milestone by implementing a complete ray tracing engine in OpenCL, allowing them to fully offload the process to the GPU. It’s this ray tracing engine we’re testing.
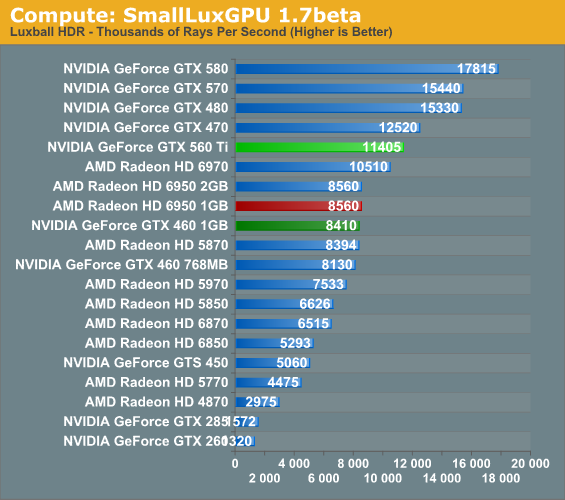
Small Lux GPU is the other test in our suite where NVIDIA’s drivers significantly revised our numbers. Where this test previously favored raw theoretical performance, giving the vector-based Radeons an advantage, NVIDIA has now shot well ahead. Given the rough state of both AMD and NVIDIA’s OpenCL drivers, we’re attributing this to bug fixes or possibly enhancements in NVIDIA’s OpenCL driver, with the former seeming particularly likely. However NVIDIA is not alone when it comes to driver fixes, and AMD has seem a similar uptick against the newly released 6900 series. It’s not nearly the leap NVIDIA saw, but it’s good for around 25%-30% more rays/second under SLG. This appears to be accountable to further refinement of AMD’s VLIW4 shader compiler, which as we have previously mentioned stands to gain a good deal of performance as AMD works on optimizing it.
So where does SLG stack up after the latest driver enhancements? With NVIDIA’s rocket to the top, they’re now easily dominating this benchmark. The GTX 560 Ti is now slightly ahead of the 6970, never mind the 6950 1GB where it has a 33% lead. Rather than being a benchmark that showed the advantage of having lots of theoretical compute performance, this is now a benchmark that seems to favor NVIDIA’s compute-inspired architecture.
Our final compute benchmark is a Folding @ Home benchmark. Given NVIDIA’s focus on compute for Fermi, cards such as the GTX 560 Ti can be particularly interesting for distributed computing enthusiasts, who are usually looking for a compute card first and a gaming card second.
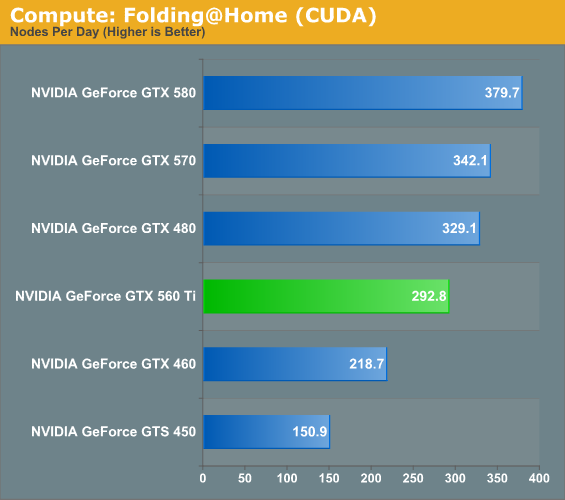
Against the senior members of the GTX 500 series and even the GTX 480 the GTX 560 Ti is still well behind, but at the same time Folding @ Home does not look like it significantly penalizes GTX 560’s superscalar architecture.
At the other end of the spectrum from GPU computing performance is GPU tessellation performance, used exclusively for graphical purposes. With Fermi NVIDIA bet heavily on tessellation, and as a result they do very well at very high tessellation factors. With 2 GPCs the GTX 560 Ti can retire 2 triangles/clock, the same rate as the Radeon HD 6900 series, so this should be a good opportunity to look at theoretical architectural performance versus actual performance.
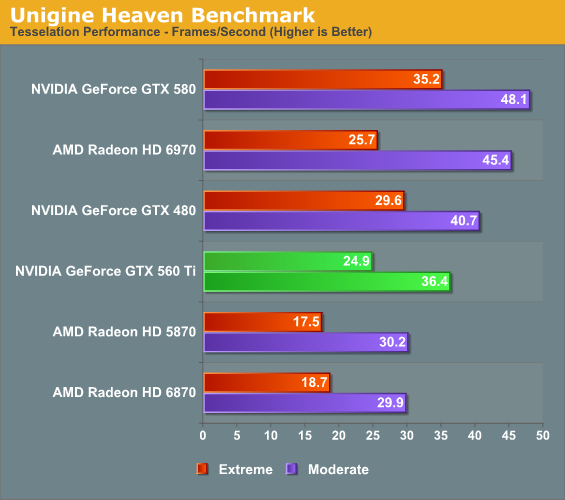
Against the AMD 5800 and 6800 series, the GTX 560 enjoys a solid advantage, as it’s able to retire twice as many triangles per clock as either architecture. And while it falls to both GTX 480 and GTX 580, the otherwise faster Radeon HD 6970 is close at times – at moderate tessellation it has quite the lead, but the two are neck-and-neck at extreme tessellation where triangle throughput and the ability to efficiently handle high tessellation factors counts for everything. Though since Heaven is a synthetic benchmark at the moment (the DX11 engine isn’t currently used in any games) we’re less concerned with performance relative to AMD’s cards and more concerned with performance relative to the other NVIDIA cards.
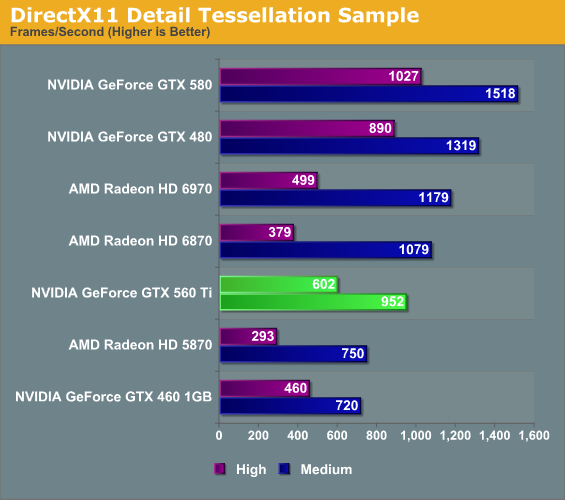
Microsoft’s Detail Tessellation sample program showcases NVIDIA’s bet on tessellation performance even more clearly. NVIDIA needs very high tessellation factors to shine compared to AMD’s cards. Meanwhile against the GTX 460 1GB our gains are a bit more muted; even though this is almost strictly a theoretical test, the GTX 560 only gains 30% on the GTX 460. Ultimately while the additional SM unlocks another tessellator on NVIDIA’s hardware, it does not unlock a higher triangle throughput rate, which is dictated by the GPCs.


87 Comments
View All Comments
ImSpartacus - Tuesday, January 25, 2011 - link
Page one, first chart, the 560 Ti is "$149" instead of "$249".Although, I kinda prefer the former.
alcortez - Tuesday, January 25, 2011 - link
...wow a 460 for negative $160.I want in on that. ;)
loubarouba - Tuesday, January 25, 2011 - link
lol thats definitely an approximately sign (~)...unless of course i was late and has already been edited to that..7Enigma - Tuesday, January 25, 2011 - link
Listed at $149 when you meant to write $249.7Enigma - Tuesday, January 25, 2011 - link
1st chart to clarify.vol7ron - Tuesday, January 25, 2011 - link
I think ImSpartacus beat you to it ;)ImSpartacus - Tuesday, January 25, 2011 - link
Yeah, I was secretly hoping to be the first to mention that. I feel special!.)
Rocket321 - Tuesday, January 25, 2011 - link
pg. 16 - Series Load Voltage chart has wrong title.7Enigma - Tuesday, January 25, 2011 - link
what's crazy is that when I posted and refreshed the page I was the only comment. It wasn't until page 3-4 of this review (as I was reading after the comment post) that I noticed yours was there so there is some lag between when a post is made and when others see it (even though you see it right away). I wish we had a time stamp feature on the post! :)maniac5999 - Tuesday, January 25, 2011 - link
So the GTX 560 Ti has a 4004mhz DATE rate? Wow, it sure gets around. (chart on P1) ;-)