ASUS P5B-E: P965 stepping C1 versus C2, Round One
by Gary Key on October 4, 2006 9:00 AM EST- Posted in
- CPUs
Gaming Performance
As usual, gaming performance was tested with a variety of current games. Our review is based on the performance capability of each stepping so we are also including the 1024x768 resolution that is not typically bound by GPU performance in our game benchmarks. We also ran benchmarks with our standard 1280x1024 resolution with 4x antialiasing and with 8x anisotropic filtering (if the game has support) enabled. Given the number of users that run 19 inch LCDs these days, 1280x1024 represents one of the most commonly used resolutions. We decided to also stress the graphics subsystem since we are benchmark testing the overall system capability to compare the performance between the C1 and C2 stepping. In order to do this we were particularly interested in increasing the resolutions and graphic settings so we are including 1600x1200 4xAA/8xAF and 1920x1200 4xAA/8XAF resolutions to see if there are any noticeable differences between the boards when stressed.
Battlefield 2
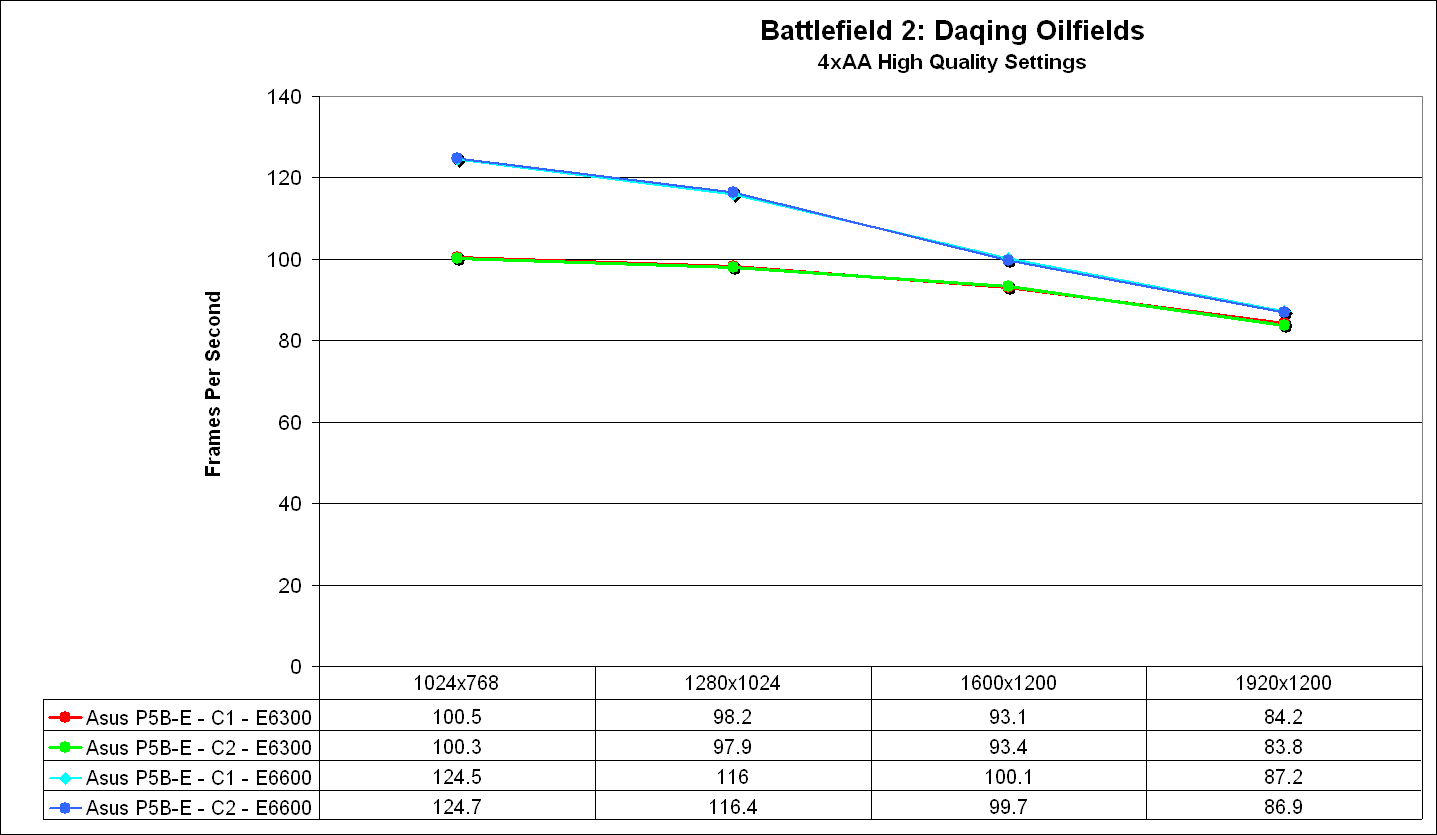
This benchmark is performed using DICE's built-in demo playback functionality with additional capture capabilities designed in house. When using the built-in demo playback features of BF2, frames rendered during the loading screen are counted in the benchmark. In order to get a real idea of performance, we use the instantaneous frame time and frames per second data generated from our benchmark run. We discard the data collected during the loading screen and calculate a result that represents actual game play. While DICE maintains that results over 100fps aren't always reliable, our methods have allowed us to get useful data from high performing systems.
During the benchmark, the camera switches between players and vehicles in order to capture the most action possible. There is a significant amount of smoke, explosions, and vehicle usage as this a very GPU intensive Battlefield 2 benchmark. We run Battlefield 2 using the highest quality graphics settings available in the video settings. The game itself is best experienced with average in-game frame rates of 35 and up.
Serious Sam 2
This benchmark is performed using Croteam's built-in demo capability in the Serious Sam II engine. We utilize the included Branchester Demo and capture the playback results using the Ctrl-~ function. The benchmark features a large number of combatants, explosions, and general mayhem. The benchmark is primarily GPU sensitive with the actual percentage of GPU/CPU/Audio activity being displayed during the benchmark run. We typically find this game is very playable at average in-game rates of 60 and above. We maximize all settings except antialiasing and anisotropic filtering within the general and advanced video settings.
Half Life 2: Episode One
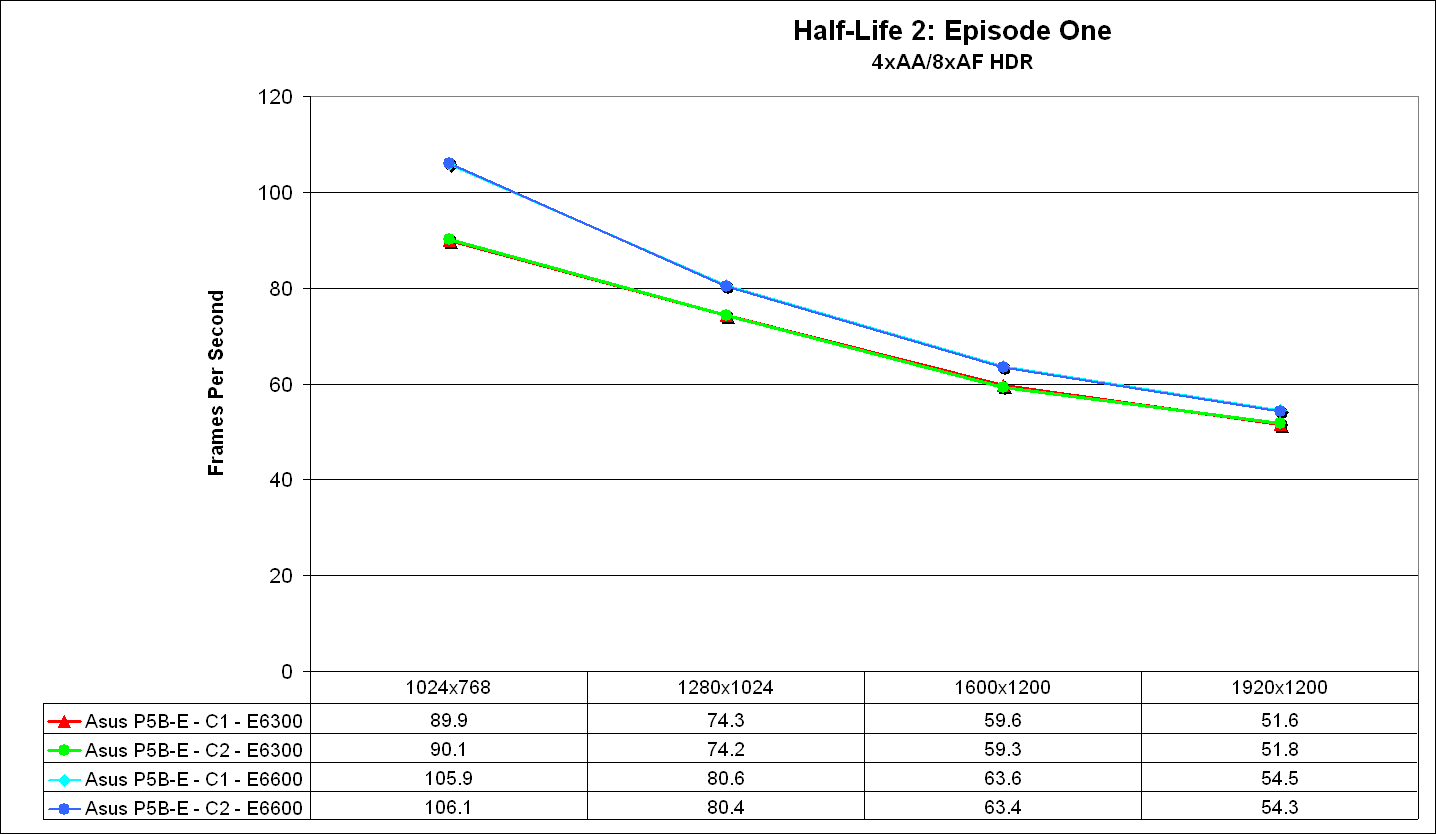
The Half Life 2: Lost Coast level demonstration first introduced Valve's HDR technology. While certain developers have implemented HDR, there have been several issues with antialiasing (even on ATI cards) being an option. Valve placed a high value on building an HDR implementation that everyone can use with whatever AA/AF settings they want to select. As Lost Coast is essentially a technology demo rather than a full game, we have switched over to Episode One for Source engine performance testing.
We use the built-in timedemo feature to benchmark the game. Our timedemo consists of a protracted battle with a Combine Gunship that takes place in a building, with the walls and ceiling falling apart from all the explosions. The Source engine timedemo feature is similar to the nettimedemo of Id's Doom 3 engine, in that it plays back more than just the graphics. The highest visual quality settings possible were used with HDR turned on. While the Source engine is notorious for giving great frame rates for almost any hardware setup, we find the game isn't as enjoyable if it isn't running at 35fps or above.
Overall in our first series of game benchmarks we find the performance between the C1 and C2 stepping motherboards to be a toss-up. These results are not really surprising based on our previous testing and just goes to show the chipsets are for all purposes are equal in performance. In all three games we see the E6600 outscoring the E6300 by up to 21% at the lower resolutions with the performance gap closing rapidly as the games become more GPU limited at the higher resolutions.
As usual, gaming performance was tested with a variety of current games. Our review is based on the performance capability of each stepping so we are also including the 1024x768 resolution that is not typically bound by GPU performance in our game benchmarks. We also ran benchmarks with our standard 1280x1024 resolution with 4x antialiasing and with 8x anisotropic filtering (if the game has support) enabled. Given the number of users that run 19 inch LCDs these days, 1280x1024 represents one of the most commonly used resolutions. We decided to also stress the graphics subsystem since we are benchmark testing the overall system capability to compare the performance between the C1 and C2 stepping. In order to do this we were particularly interested in increasing the resolutions and graphic settings so we are including 1600x1200 4xAA/8xAF and 1920x1200 4xAA/8XAF resolutions to see if there are any noticeable differences between the boards when stressed.
Battlefield 2
This benchmark is performed using DICE's built-in demo playback functionality with additional capture capabilities designed in house. When using the built-in demo playback features of BF2, frames rendered during the loading screen are counted in the benchmark. In order to get a real idea of performance, we use the instantaneous frame time and frames per second data generated from our benchmark run. We discard the data collected during the loading screen and calculate a result that represents actual game play. While DICE maintains that results over 100fps aren't always reliable, our methods have allowed us to get useful data from high performing systems.
During the benchmark, the camera switches between players and vehicles in order to capture the most action possible. There is a significant amount of smoke, explosions, and vehicle usage as this a very GPU intensive Battlefield 2 benchmark. We run Battlefield 2 using the highest quality graphics settings available in the video settings. The game itself is best experienced with average in-game frame rates of 35 and up.
 |
| Click to enlarge |
Serious Sam 2
This benchmark is performed using Croteam's built-in demo capability in the Serious Sam II engine. We utilize the included Branchester Demo and capture the playback results using the Ctrl-~ function. The benchmark features a large number of combatants, explosions, and general mayhem. The benchmark is primarily GPU sensitive with the actual percentage of GPU/CPU/Audio activity being displayed during the benchmark run. We typically find this game is very playable at average in-game rates of 60 and above. We maximize all settings except antialiasing and anisotropic filtering within the general and advanced video settings.
 |
| Click to enlarge |
Half Life 2: Episode One
The Half Life 2: Lost Coast level demonstration first introduced Valve's HDR technology. While certain developers have implemented HDR, there have been several issues with antialiasing (even on ATI cards) being an option. Valve placed a high value on building an HDR implementation that everyone can use with whatever AA/AF settings they want to select. As Lost Coast is essentially a technology demo rather than a full game, we have switched over to Episode One for Source engine performance testing.
We use the built-in timedemo feature to benchmark the game. Our timedemo consists of a protracted battle with a Combine Gunship that takes place in a building, with the walls and ceiling falling apart from all the explosions. The Source engine timedemo feature is similar to the nettimedemo of Id's Doom 3 engine, in that it plays back more than just the graphics. The highest visual quality settings possible were used with HDR turned on. While the Source engine is notorious for giving great frame rates for almost any hardware setup, we find the game isn't as enjoyable if it isn't running at 35fps or above.
 |
| Click to enlarge |
Overall in our first series of game benchmarks we find the performance between the C1 and C2 stepping motherboards to be a toss-up. These results are not really surprising based on our previous testing and just goes to show the chipsets are for all purposes are equal in performance. In all three games we see the E6600 outscoring the E6300 by up to 21% at the lower resolutions with the performance gap closing rapidly as the games become more GPU limited at the higher resolutions.


27 Comments
View All Comments
crash6767 - Friday, January 26, 2007 - link
ORDER PLACED 1/23/2007 9:10:24 PM FROM NEWEGG.COM.RECEIVED 1/26/2007 1:14 PM.
MODEL NUMBER PRINTED ON CIRCUIT BOARD, ABOVE DIMM A1:
P5B-E 1.02G
YYYYYYYYYEEEEEEEEEEEEEEEEEEEESSSSSSSSSSSSSSSSSSSSSSSSSSSSSSSSSSSSSSSSSSSSSSS!!!!!!!!!!!!!!!!!!!!!
still waiting on the power supply to arrive (purchased from another retailer) so no OC numbers yet. BUT 1.02G IS ALIVE AND KICKING!!!!#!#!@!#@!@
*crossposted everywhere*
agigolo - Wednesday, October 11, 2006 - link
Ok, so I've read this and the unfortunate part (unless I missed it and I don't think I did) but when these acronyms are used (like MCH) I wish they would be defined on the 1st useage... can someone be a good soul and explain MCH please???Gary Key - Wednesday, October 11, 2006 - link
MCH - Memory Controller Hub, aka Northbridge. :)cornfedone - Sunday, October 8, 2006 - link
We've seen time and time again in the past few years where rushed out the door mobos are over-hyped and in fact don't perform as advertised. Many don't even run industry standard memory without problems which is a disgrace. These boards are way over priced and sought by naive consumers after they read the glowing online reviews that fail to mention the many defects in these products.Once the motherboard problems start to get online exposure the mobo makers move to the next model chipset and rave how it's so much better than the previous model. Naturally the mobo companies don't fix the problems with the previous products they shipped and in many cases refuse to even acknowledge the defects that become confirmed by tens of thousands of duped customers. Instead the mobo companies whip out the next trick of the week half baked mobo and make sure that hardware review sites get "special" versions for testing so the reviews are always positive despite the production board defects that exist. Unless a reviewer is buying the retail mobo from a retail outlet, they ain't necessarily getting the same mobo as all other consumers.
You gotta wonder if the gullible fanboys will ever wake up to this scam or if they will keep paying through the nose for defective, over priced mobos. As long as sheep keep buying these dysfunctional mobos the manufacturers will keep shipping garbage. There is no incentive to deliver a properly functioning mobo if the sheep will buy half baked goods at twice the price they should sell for.
The C1 / C2 chipset deal is just another example of hype yet people will believe the C2 will provide a 20% performance increase because they are so gullible. One accurate scientific test is worth much more than a thousand online opinions. The fanboys need to buy a clue instead of pissing their money away on crappy mobos and over hyped chipsets.
Binkt - Thursday, October 5, 2006 - link
Hi, nice sleuthing so far guys, thanks.One thing that concerns me is the NB temperature. My Gigabyte 965p-DS3 has a very high operating temperature and I was wondering if you had observed a difference between the steppings in this regard.
Gary Key - Thursday, October 5, 2006 - link
Hi,There were no temperature differences between the two boards on the MCH. We highly recommend that you replace the paste on the MCH heatsink with AS5 and place a 40mm on it if you plan on overclocking 24/7. The same holds true with the DS3, on my personal system I just replaced the MCH heatsink with this one - http://www.newegg.com/Product/Product.asp?Item=N82...">SwiftTech.
jambaz - Thursday, October 5, 2006 - link
http://images.anandtech.com/reviews/motherboards/a...">synthetichttp://images.anandtech.com/reviews/motherboards/a...This picture shows a CPU speed of 2.4 Ghz when really the speeds are 1.86, 3.6 and 2.4 Ghz. The "general" picture below has the correct way of showing it imho.
By the way, it would be nice if Anandtech would try to show performance of a lowbudget e6300 paired with value ram instead of this RAM they use that cost 800$..
Like the benchmarks we see now are 1:1 @ 515 Mhz = DDR1030, but what if you did 5:4 or 4:3 so ram would be less of an expense?
Thanks for great articles!
JarredWalton - Thursday, October 5, 2006 - link
I don't believe you can go lower than 1:1 with the 975X/P965 chipsets and Core 2 Duo. That was from the days of Pentium 4/D where you could run the FSB at a higher speed than the RAM. So if you want to overclock, either you pay a boatload of money on RAM, or you don't OC as far, or you get a more expensive CPU. Not great choices unfortunately.lopri - Thursday, October 5, 2006 - link
I can do memory frequency lower than FSB on P5W-DH. Of course it is not a recommended configuration.JarredWalton - Friday, October 6, 2006 - link
Must vary by motherboard/BIOS implementation. I know I've seen several boards where 1:1 (DDR2-533) is the lowest possible selection. Or maybe there was a DDR2-400 choice I missed? Meh - can't check now, since I don't have the systems anymore.