Seagate Barracuda 7200.10 750GB: Size Does Matter
by Gary Key on May 18, 2006 9:00 AM EST- Posted in
- Storage
IPEAK File Transfer Tests
Our IPEAK based File Transfer benchmarks indicate how well a drive performs in a strictly read or write operation with a limited number of files (29) but a large amount of data (7.55GB). The test is designed to ensure continual write or read operations across a large section of the drive that requires constant track to track seek requests, actuator movements, and caching large amounts of data.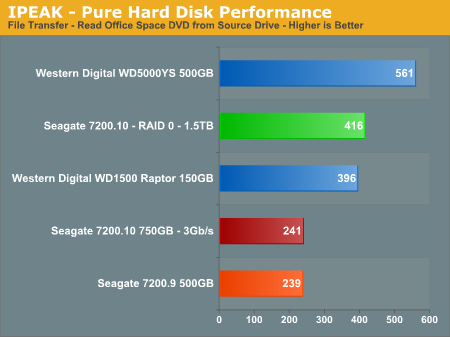
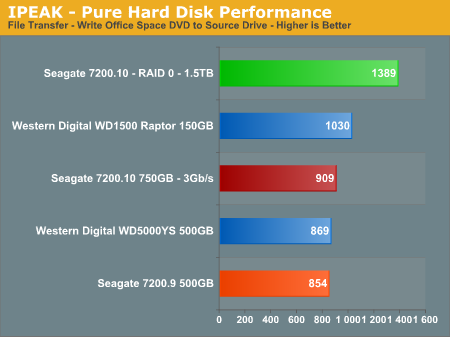
The write performance, and to some degree the read performance, of the 7200.10 RAID 0 combination is impressive in these benchmarks. While we are measuring the actual performance of the hard drive, this is one instance where the RAID 0 setup would show benefits in applications by reducing the time to transfer files.
The Seagate 7200.10 and 7200.9 read performance is dismal compared to the other drives while their write performance is very good. This is very interesting as their read performance in the antivirus test was very good. After further examination of the trace files we noticed the read requests in the antivirus test consisted of mostly small block sizes in irregular patterns compared to very large block sizes in a continual pattern in the file transfer test. It appears in our first couple of benchmarks that the read performance of the 7200.10 drive will be something of interest to look for in the balance of our tests.
Only the RAID 0 result saves the 7200.10 from a very embarrassing performance in this read benchmark and even then it fails to exceed the WD RE2 500GB drive. Speaking of the WD drive, we ran our test repeatedly, created a new trace file, changed drives, and then broke out the stop watch to verify the performance of this drive in our read test. The performance of this drive was fantastic in the read section and quietly fell in behind the Raptor and 7200.10 in the write performance benchmark.
IPEAK Video/Audio Tests
The IPEAK based Video/Audio benchmarks are designed around media encoding and simulating HTPC activities. These are basic benchmarks at this time as this section will be expanded greatly with some new tools that we have developed along with our business partners. Our change to a dual core processor will assist us in maintaining a balance between the CPU and Storage systems during the trace file creation and benchmarking processes. These benchmarks are CPU intensive in nature but also require a balanced storage system with the ability to handle read and write requests simultaneously in a very efficient manner.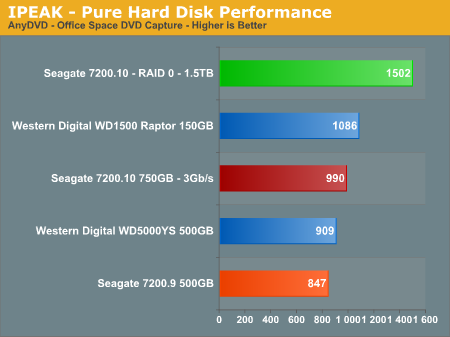
The AnyDVD benchmark is heavily weighted to write requests with the results showing the continued performance advantages of the WD Raptor at the expense of storage capacity, something our Seagate 7200.10 750GB drive has in excess. The performance of the 7200.10 is excellent with a 9% advantage over the WD RE2 and 16% over the 7200.9 drive.
The RAID 0 performance shows the continued strength of this combination in the more intensive I/O benchmarks. Any enthusiasm about the RAID 0 scores should be tempered by the fact that we are measuring hard disk I/O performance and not overall platform performance as several factors within your system can greatly mitigate any advantages we might see in these results. RAID 0 is generally useful in applications where data files are very large and/or data requests are highly sequential in nature, in this case our particular encoding and streaming benchmarks are fit for RAID 0 as it reduces our file transfer times within the actual application.
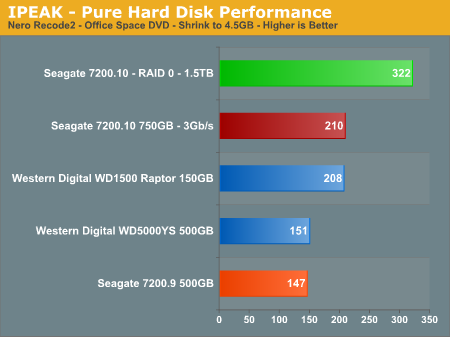
The NeroRecode 2 benchmark is weighted to streaming read requests but is balanced by continuous write operations. This benchmark is one of the most demanding ones in our test suite with the disk being active the entire trace file with several 100% utilization peaks. The Seagate 7200.10 posts the best scores here with a victory over the Raptor and finishing ahead of the other two 7200 RPM drives by 39%. The inconsistent read results we witnessed earlier were not evident in this benchmark.
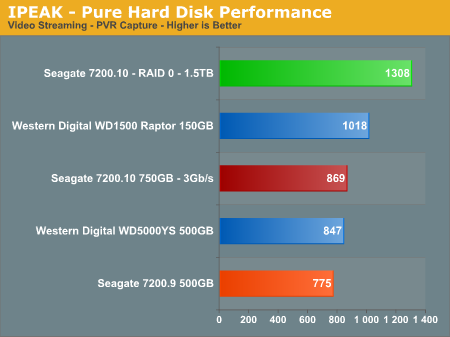
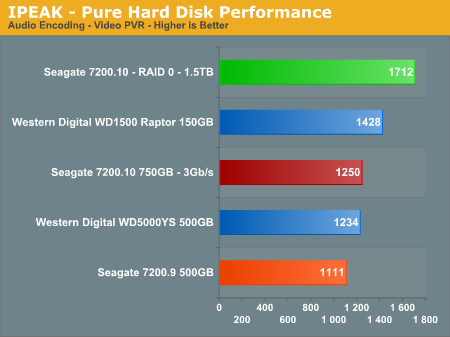
Our video and audio encoding benchmarks while streaming a video feed continues to show the strength of the Seagate 7200.10 in the media application benchmarks. While falling behind the Raptor in these two benchmarks, this drive has no trouble finishing ahead of its main competition. The Seagate 7200.10 outperforms the 7200.9 by 12% in both of the media multitasking benchmarks. The drive has very balanced performance and would easily be at home in a HTPC configuration. In fact, this drive should have "PVR Recommended" stamped all over it provided the acoustic levels are acceptable.


44 Comments
View All Comments
JakeBlade - Friday, May 26, 2006 - link
Interesting that this drive has a MADE IN SINGAPORE label instead of Seagate's usual MADE IN CHINA junk.ElFenix - Friday, May 19, 2006 - link
no reason to upgrade from my SE16, i see.i'd like to see a couple more drives in tests, such as the latest hitachi.
Gary Key - Friday, May 19, 2006 - link
The reason we did not include the Hitachi unit is we have the revised 500GB unit arriving shortly and as mentioned in the article we will have a complete 500GB roundup with the new 7200.10 also. It will take some time to build the database with the revised test suite as we also have additional application timer tests coming shortly.
The performance across most of the recently released mainstream drives is so close now that it comes down to a personal decision on warranty, reliability, thermals/acoustics, and capacity for the most part. However, drives like the Raptor and RE2 series do make things interesting for SATA on the desktop as did this drive for a PVR fanatic. ;-)
ElFenix - Friday, May 19, 2006 - link
i'd also like to see audio tests from a little bit further away. 5 mm doesn't give a realistic idea of how loud it will be sitting 3 feet away on the floor. plus, for all i know where you place the microphone is extremely important when at 5 mm.Gary Key - Friday, May 19, 2006 - link
There is no one good area to measure the acoustics as you never know where the PC will be located, what type of case, fan noise, or ambient sounds are present. I can tell you that a drive that is loud at 3mm~5mm will be loud at three feet with all things being equal. Sound tones are also very subjective, the dull thumping sound the drive has under load might be perfectly acceptable while the higher pitched clicking sound of a Maxtor will be unbearable for some people.
We place the two mics at different points on the drive to ensure a consistent recording point, we assume most people will utilize a horizontal mounting point with the rear of the drive facing the case front, although we test the drive facing the case side also as this cage design is becoming very popular. The tone of the drive can change dramatically with the addition of rubber washers between the drive and the mount points.
Thanks for the comments. :)
jhvtoor - Friday, May 19, 2006 - link
Temperature measurement using S.M.A.R.T. is not reliable. The sensor and electronics on the harddrive are used, en they are not calibrated.
I am using the freeware "HDD Health" utility to monitor the SMART information. It reported the drive temperature of my desktop is 12 degrees celcius immediatly after winXP boot, while the room temperature is 19 degrees.... I am not using cooling techniques on this drive. This can only be explained by an inaccurate temperature measurement of this drive.
I would suggest to use one an independent measurement instument in the future. Attach the sensor in the middle of the cover plate.
Gary Key - Friday, May 19, 2006 - link
Hi,1. We have found S.M.A.R.T. to be "fairly" accurate along with our capture utility. We know it is not perfect but it allows us a consistent measurement of each drive in testing. In our 7200.10 test ActiveSmart reported a temperature of 26c after boot, room temp was 22c. We put the drive through 15 minutes of light usage, let it idle for 15 minutes, and then report this number as our idle number. All of the drives we have tested have followed the same pattern with a consistent idle reading after this usage, the idle temp will be the same 15 or 30 minutes later. If you stress the drive, you will see the temps rise accordingly and then fall back to the standing idle temp during the cooldown phase.
2. One drawback is the temperatures are not "real" time, there is a delay built in, this is why on the load test (also idle) we loop PCMark05 several times and then take the reported temperature at the end of the session, generally the high temperature was actually reached in the previous loop.
3. We have have tried using a sensor, infrared, and other methods with varying results. The problem is each section of the drive will report a different number. When we utilized a sensor on the top plate, the temps varied from drive to drive with the same model being tested. Each supplier uses different materials for their casings so that creates greater variables, it just is not consistent enough to report.
toattett - Thursday, May 18, 2006 - link
Apparently,If I want a speedy drive, I buy the raptor.
If I want a super large drive, I buy the new 750GB Seagate.
If I want good performance and good amount of stoarge, I buy the 500GB WD.
Missing Ghost - Thursday, May 18, 2006 - link
The pictures for the noise level are wrong. You put the dbA level as if it was a linear scale. It's not that way, the space between 0dB and 10dB should be smaller than the space between 10dB and 20dB. That way it will show more clearly the difference between the noise levels. It's a logarithmic scale.Gary Key - Thursday, May 18, 2006 - link
Our current graph engine will not allow us to do this type of scale manipulation. We will probably have to utilize a Microsoft Excel chart in the next article. We agree with you, just not possible with the internal engine at this time although we are working on a new one.