Seagate Barracuda 7200.10 750GB: Size Does Matter
by Gary Key on May 18, 2006 9:00 AM EST- Posted in
- Storage
Actual Application Times
Our application time tests are designed to show application performance results with times being reported in minutes / seconds or seconds only with lower scores being better. While these tests will show some differences between the drives it is important to understand we are no longer measuring the pure performance of the hard drive but how well our platform performs with each individual drive. The performance of a hard drive is an integral part of the computer platform but other factors such as memory, CPU, core logic, and even driver choice can play a major role in determining how well the hard drive performs in any given task.Game Load Tests
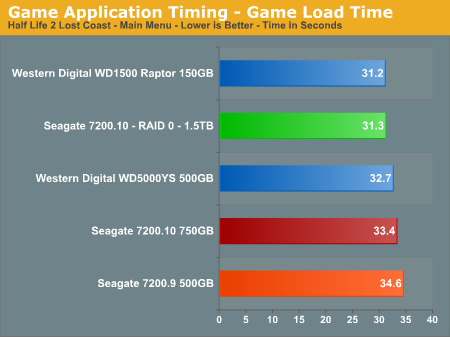
In our Half Life 2 - Lost Coast test we measure the time it takes to load the game with the application timer starting when the play game icon is initiated in the Steam menu until the Main game menu appears. The results follow our overall IPEAK game results with the Western Digital drives performing up to 10% better in this benchmark. The Seagate RAID 0 setup almost surpasses the WD Raptor in this test and performs slightly better than the single 750GB drive. We are still trying to develop a repeatable trace file for this game to include in our IPEAK test suite as the game has one of the longer loading sequences in our test library.
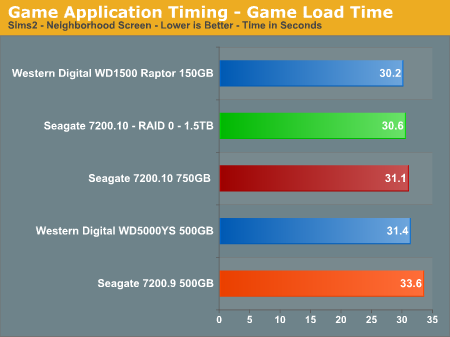
Our Sims 2 - Open for Business test measures the time it takes to load the initial portion of the game. Our application timer starts when the game icon is initiated until the neighborhood menu appears. The results are slightly different than our IPEAK results with the Seagate 7200.10 finishing ahead of the WD RE2 500GB drive. The RAID 0 setup offers a 1% improvement in this benchmark. The WD Raptor continues to lead all drives but the actual differences are so minor that any drive in our test roundup will be more than acceptable for general game play.
Game Level Load Tests
Our tests center around the actual loading of a playable level within our game selections.
- The Half Life 2 - Lost Coast test measures the time it takes to load a new game. Our application timer starts when the start new game icon is initiated and ends when the character is on screen with the 357 magnum visible.
- The Sims 2 - Open for Business test measures the time it takes to load the Downtown sector of the game from Veronaville. Our application timer starts when the Downtown game icon is initiated and ends when the downtown graphics are visible.
- The Battlefield 2 test measures the time it takes to load the Daqing Oilfields level. Our application timer begins when the start singleplayer icon is initiated and ends when the join game icon is visible.
- The Oblivion test measures the time it takes to load the Weye level in our saved game files. Our application timer begines when the load saved game icon is initiated and ends when the character is visible on screen.
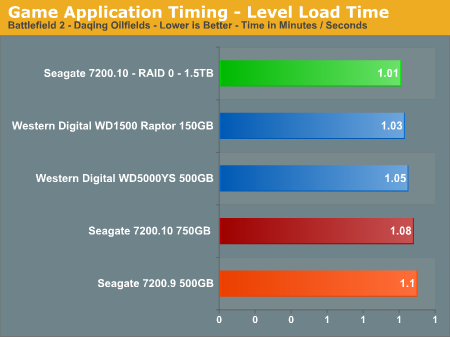
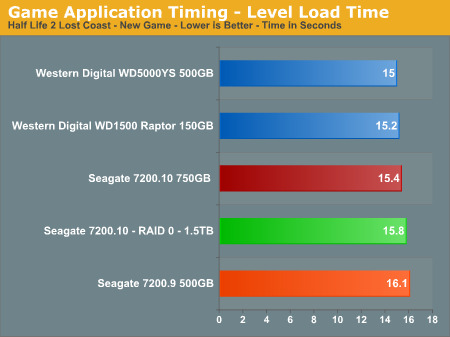
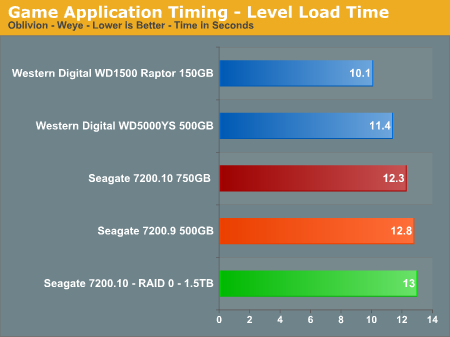
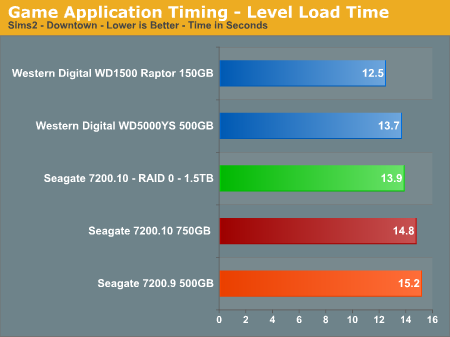
The WD Raptor continues its pattern of being the best available drive for the game enthusiast, although with a limited storage capacity it is certainly an expensive proposition for the general desktop user who typically will sacrifice speed for storage. RAID 0 finally shows up to the party and offers a 7% improvement in the Battlefield 2 scores but otherwise does not offer any tangible benefits, and it even posts slower load times in the Oblivion and Half Life 2 benchmarks. The Seagate 7200.10 does show improvements over the 7200.9 series and is competitive with the WD RE2 500GB drive these benchmarks.
WinRAR 3.51 Tests
Our WinRAR tests measure the time it takes to compress our test folder that contains 444 files, 10 folders, and contains 602MB of data. This is same test folder utilized in our IPEAK test suite. While the benchmark is extremely CPU intensive for the compression test it still requires a fast storage system to keep pace with the CPU.
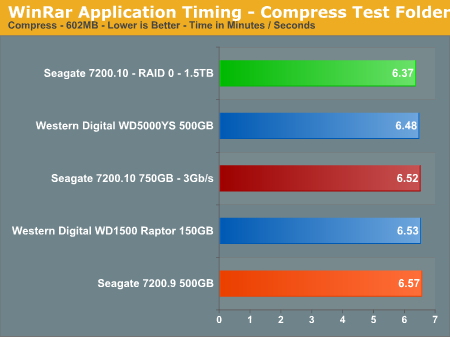
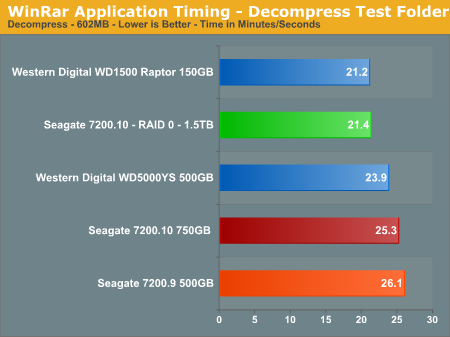
The compression tests mimic our IPEAK results with the WD RE2 500GB drive having the top score, followed by the Seagate 7200.10 unit. RAID 0 offers a 3% improvement in this benchmark where CPU choice is critical. In our testing with version 3.63 that fully supports multithreading, our dual core processor offers up to a 53% improvement in this benchmark. In our decompression test all of the drives are within a couple of percent of each other, with the Raptor back in the lead and our RAID 0 setup almost equaling its score.
AnyDVD 5.9.6
Our final test has us utilizing the "ripping" function of AnyDVD to copy the Office Space DVD file from our source drive to our test drive. Our DVD features 29 files totaling 7.55GB of data and is an excellent test for determining the write speed of a drive.
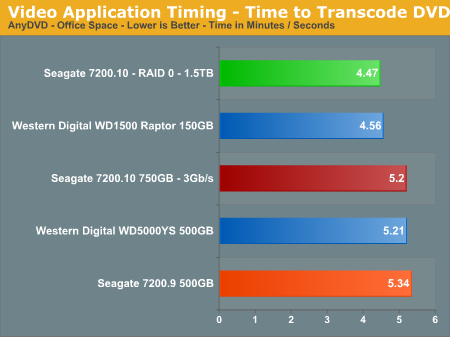
The test results show what we all know: speed kills. In this case, the WD Raptor posts an impressive score with the WD RE2 and Seagate 7200.10 finishing 13% behind. Our RAID 0 setup wakes up and finally takes a first place finish as the large sequential writes in this test are a natural fit for this setup. The Seagate 7200.10 continues to offer slightly better performance than the 7200.9 while providing a 50% increase in storage space, perfect for the audio/video enthusiast.


44 Comments
View All Comments
JakeBlade - Friday, May 26, 2006 - link
Interesting that this drive has a MADE IN SINGAPORE label instead of Seagate's usual MADE IN CHINA junk.ElFenix - Friday, May 19, 2006 - link
no reason to upgrade from my SE16, i see.i'd like to see a couple more drives in tests, such as the latest hitachi.
Gary Key - Friday, May 19, 2006 - link
The reason we did not include the Hitachi unit is we have the revised 500GB unit arriving shortly and as mentioned in the article we will have a complete 500GB roundup with the new 7200.10 also. It will take some time to build the database with the revised test suite as we also have additional application timer tests coming shortly.
The performance across most of the recently released mainstream drives is so close now that it comes down to a personal decision on warranty, reliability, thermals/acoustics, and capacity for the most part. However, drives like the Raptor and RE2 series do make things interesting for SATA on the desktop as did this drive for a PVR fanatic. ;-)
ElFenix - Friday, May 19, 2006 - link
i'd also like to see audio tests from a little bit further away. 5 mm doesn't give a realistic idea of how loud it will be sitting 3 feet away on the floor. plus, for all i know where you place the microphone is extremely important when at 5 mm.Gary Key - Friday, May 19, 2006 - link
There is no one good area to measure the acoustics as you never know where the PC will be located, what type of case, fan noise, or ambient sounds are present. I can tell you that a drive that is loud at 3mm~5mm will be loud at three feet with all things being equal. Sound tones are also very subjective, the dull thumping sound the drive has under load might be perfectly acceptable while the higher pitched clicking sound of a Maxtor will be unbearable for some people.
We place the two mics at different points on the drive to ensure a consistent recording point, we assume most people will utilize a horizontal mounting point with the rear of the drive facing the case front, although we test the drive facing the case side also as this cage design is becoming very popular. The tone of the drive can change dramatically with the addition of rubber washers between the drive and the mount points.
Thanks for the comments. :)
jhvtoor - Friday, May 19, 2006 - link
Temperature measurement using S.M.A.R.T. is not reliable. The sensor and electronics on the harddrive are used, en they are not calibrated.
I am using the freeware "HDD Health" utility to monitor the SMART information. It reported the drive temperature of my desktop is 12 degrees celcius immediatly after winXP boot, while the room temperature is 19 degrees.... I am not using cooling techniques on this drive. This can only be explained by an inaccurate temperature measurement of this drive.
I would suggest to use one an independent measurement instument in the future. Attach the sensor in the middle of the cover plate.
Gary Key - Friday, May 19, 2006 - link
Hi,1. We have found S.M.A.R.T. to be "fairly" accurate along with our capture utility. We know it is not perfect but it allows us a consistent measurement of each drive in testing. In our 7200.10 test ActiveSmart reported a temperature of 26c after boot, room temp was 22c. We put the drive through 15 minutes of light usage, let it idle for 15 minutes, and then report this number as our idle number. All of the drives we have tested have followed the same pattern with a consistent idle reading after this usage, the idle temp will be the same 15 or 30 minutes later. If you stress the drive, you will see the temps rise accordingly and then fall back to the standing idle temp during the cooldown phase.
2. One drawback is the temperatures are not "real" time, there is a delay built in, this is why on the load test (also idle) we loop PCMark05 several times and then take the reported temperature at the end of the session, generally the high temperature was actually reached in the previous loop.
3. We have have tried using a sensor, infrared, and other methods with varying results. The problem is each section of the drive will report a different number. When we utilized a sensor on the top plate, the temps varied from drive to drive with the same model being tested. Each supplier uses different materials for their casings so that creates greater variables, it just is not consistent enough to report.
toattett - Thursday, May 18, 2006 - link
Apparently,If I want a speedy drive, I buy the raptor.
If I want a super large drive, I buy the new 750GB Seagate.
If I want good performance and good amount of stoarge, I buy the 500GB WD.
Missing Ghost - Thursday, May 18, 2006 - link
The pictures for the noise level are wrong. You put the dbA level as if it was a linear scale. It's not that way, the space between 0dB and 10dB should be smaller than the space between 10dB and 20dB. That way it will show more clearly the difference between the noise levels. It's a logarithmic scale.Gary Key - Thursday, May 18, 2006 - link
Our current graph engine will not allow us to do this type of scale manipulation. We will probably have to utilize a Microsoft Excel chart in the next article. We agree with you, just not possible with the internal engine at this time although we are working on a new one.