AMD's Ryzen 9 6900HS Rembrandt Benchmarked: Zen3+ Power and Performance Scaling
by Dr. Ian Cutress on March 1, 2022 9:30 AM ESTSimulation
Simulation and Science have a lot of overlap in the benchmarking world, however for this distinction we’re separating into two segments mostly based on the utility of the resulting data. The benchmarks that fall under Science have a distinct use for the data they output – in our Simulation section, these act more like synthetics but at some level are still trying to simulate a given environment.
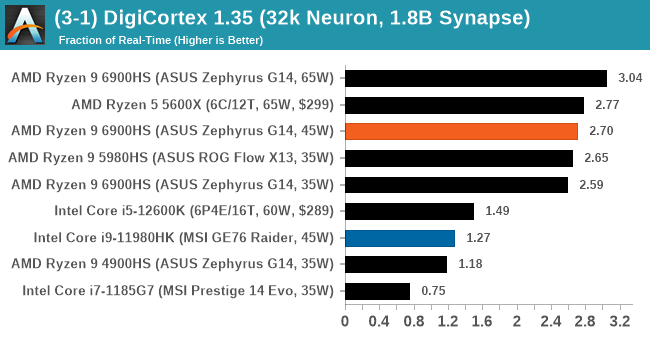
DigiCortex v1.35: link
DigiCortex is a pet project for the visualization of neuron and synapse activity in the brain. The software comes with a variety of benchmark modes, and we take the small benchmark which runs a 32k neuron/1.8B synapse simulation, similar to a small slug.
The results on the output are given as a fraction of whether the system can simulate in real-time, so anything above a value of one is suitable for real-time work. The benchmark offers a 'no firing synapse' mode, which in essence detects DRAM and bus speed, however we take the firing mode which adds CPU work with every firing.
The software originally shipped with a benchmark that recorded the first few cycles and output a result. So while fast multi-threaded processors this made the benchmark last less than a few seconds, slow dual-core processors could be running for almost an hour. There is also the issue of DigiCortex starting with a base neuron/synapse map in ‘off mode’, giving a high result in the first few cycles as none of the nodes are currently active. We found that the performance settles down into a steady state after a while (when the model is actively in use), so we asked the author to allow for a ‘warm-up’ phase and for the benchmark to be the average over a second sample time.
For our test, we give the benchmark 20000 cycles to warm up and then take the data over the next 10000 cycles seconds for the test – on a modern processor this takes 30 seconds and 150 seconds respectively. This is then repeated a minimum of 10 times, with the first three results rejected. Results are shown as a multiple of real-time calculation.
Dwarf Fortress 0.44.12: Link
Another long standing request for our benchmark suite has been Dwarf Fortress, a popular management/roguelike indie video game, first launched in 2006 and still being regularly updated today, aiming for a Steam launch sometime in the future.
Emulating the ASCII interfaces of old, this title is a rather complex beast, which can generate environments subject to millennia of rule, famous faces, peasants, and key historical figures and events. The further you get into the game, depending on the size of the world, the slower it becomes as it has to simulate more famous people, more world events, and the natural way that humanoid creatures take over an environment. Like some kind of virus.
For our test we’re using DFMark. DFMark is a benchmark built by vorsgren on the Bay12Forums that gives two different modes built on DFHack: world generation and embark. These tests can be configured, but range anywhere from 3 minutes to several hours. After analyzing the test, we ended up going for
- A Medium World, 127x127, with 550 years, 10 civilizations and 4 megabeasts
DFMark outputs the time to run any given test, so this is what we use for the output. We loop the test for as many times possible in 30 minutes.
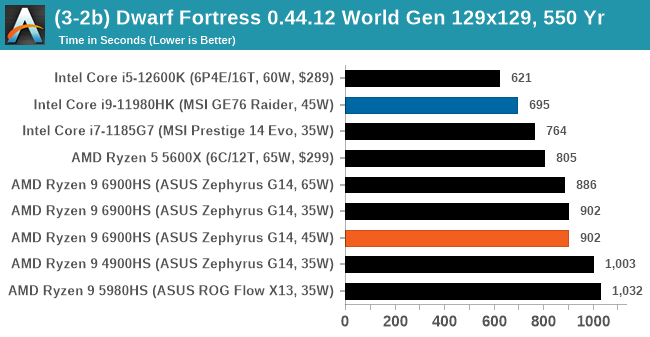
We saw a few instances where the 35W/45W results were almost identical, with the margin that the 35W would come out ahead in single threaded tasks. This may be because 35W was a fixed setting in the software options, whereas 45W was the power management framework in action.
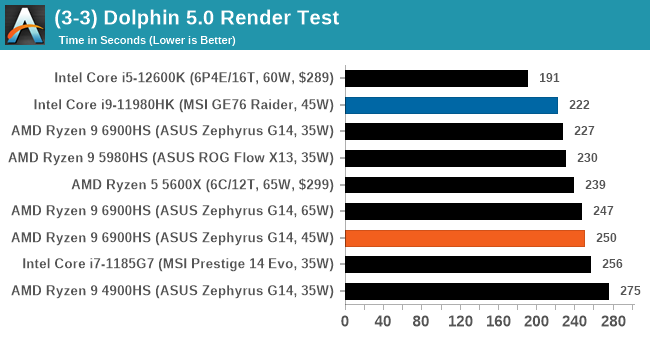
Dolphin v5.0 Emulation: Link
Many emulators are often bound by single thread CPU performance, and general reports tended to suggest that Haswell provided a significant boost to emulator performance. This benchmark runs a Wii program that ray traces a complex 3D scene inside the Dolphin Wii emulator. Performance on this benchmark is a good proxy of the speed of Dolphin CPU emulation, which is an intensive single core task using most aspects of a CPU. Results are given in seconds, where the Wii itself scores 1051 seconds.
Rendering
Rendering tests, compared to others, are often a little more simple to digest and automate. All the tests put out some sort of score or time, usually in an obtainable way that makes it fairly easy to extract. These tests are some of the most strenuous in our list, due to the highly threaded nature of rendering and ray-tracing, and can draw a lot of power. If a system is not properly configured to deal with the thermal requirements of the processor, the rendering benchmarks is where it would show most easily as the frequency drops over a sustained period of time. Most benchmarks in this case are re-run several times, and the key to this is having an appropriate idle/wait time between benchmarks to allow for temperatures to normalize from the last test.
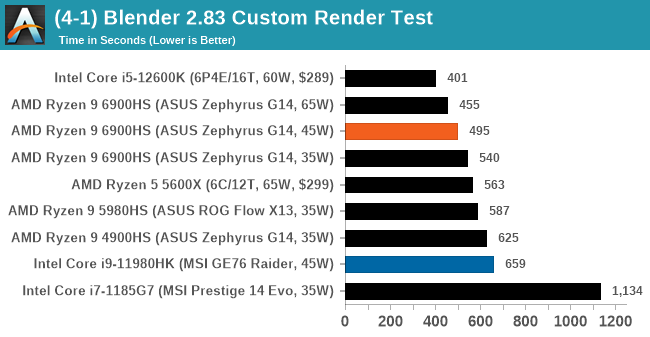
Blender 2.83 LTS: Link
One of the popular tools for rendering is Blender, with it being a public open source project that anyone in the animation industry can get involved in. This extends to conferences, use in films and VR, with a dedicated Blender Institute, and everything you might expect from a professional software package (except perhaps a professional grade support package). With it being open-source, studios can customize it in as many ways as they need to get the results they require. It ends up being a big optimization target for both Intel and AMD in this regard.
For benchmarking purposes, we fell back to one rendering a frame from a detailed project. Most reviews, as we have done in the past, focus on one of the classic Blender renders, known as BMW_27. It can take anywhere from a few minutes to almost an hour on a regular system. However now that Blender has moved onto a Long Term Support model (LTS) with the latest 2.83 release, we decided to go for something different.
We use this scene, called PartyTug at 6AM by Ian Hubert, which is the official image of Blender 2.83. It is 44.3 MB in size, and uses some of the more modern compute properties of Blender. As it is more complex than the BMW scene, but uses different aspects of the compute model, time to process is roughly similar to before. We loop the scene for at least 10 minutes, taking the average time of the completions taken. Blender offers a command-line tool for batch commands, and we redirect the output into a text file.
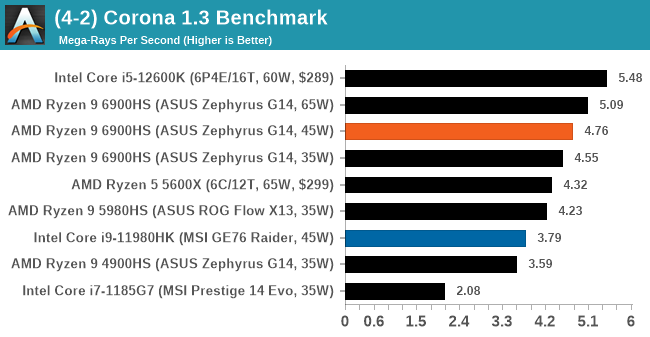
Corona 1.3: Link
Corona is billed as a popular high-performance photorealistic rendering engine for 3ds Max, with development for Cinema 4D support as well. In order to promote the software, the developers produced a downloadable benchmark on the 1.3 version of the software, with a ray-traced scene involving a military vehicle and a lot of foliage. The software does multiple passes, calculating the scene, geometry, preconditioning and rendering, with performance measured in the time to finish the benchmark (the official metric used on their website) or in rays per second (the metric we use to offer a more linear scale).
The standard benchmark provided by Corona is interface driven: the scene is calculated and displayed in front of the user, with the ability to upload the result to their online database. We got in contact with the developers, who provided us with a non-interface version that allowed for command-line entry and retrieval of the results very easily. We loop around the benchmark five times, waiting 60 seconds between each, and taking an overall average. The time to run this benchmark can be around 10 minutes on a Core i9, up to over an hour on a quad-core 2014 AMD processor or dual-core Pentium.
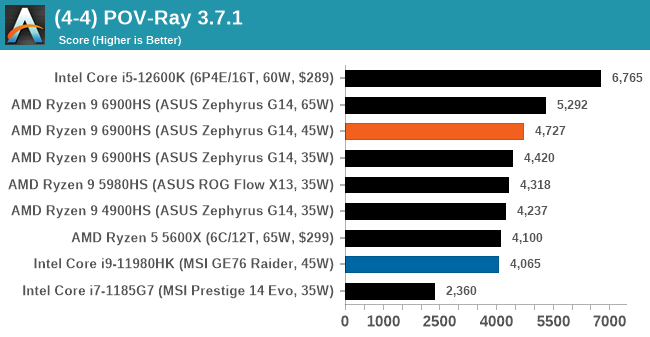
POV-Ray 3.7.1: Link
A long time benchmark staple, POV-Ray is another rendering program that is well known to load up every single thread in a system, regardless of cache and memory levels. After a long period of POV-Ray 3.7 being the latest official release, when AMD launched Ryzen the POV-Ray codebase suddenly saw a range of activity from both AMD and Intel, knowing that the software (with the built-in benchmark) would be an optimization tool for the hardware.
We had to stick a flag in the sand when it came to selecting the version that was fair to both AMD and Intel, and still relevant to end-users. Version 3.7.1 fixes a significant bug in the early 2017 code that was advised against in both Intel and AMD manuals regarding to write-after-read, leading to a nice performance boost.
The benchmark can take over 20 minutes on a slow system with few cores, or around a minute or two on a fast system, or seconds with a dual high-core count EPYC. Because POV-Ray draws a large amount of power and current, it is important to make sure the cooling is sufficient here and the system stays in its high-power state. Using a motherboard with a poor power-delivery and low airflow could create an issue that won’t be obvious in some CPU positioning if the power limit only causes a 100 MHz drop as it changes P-states.
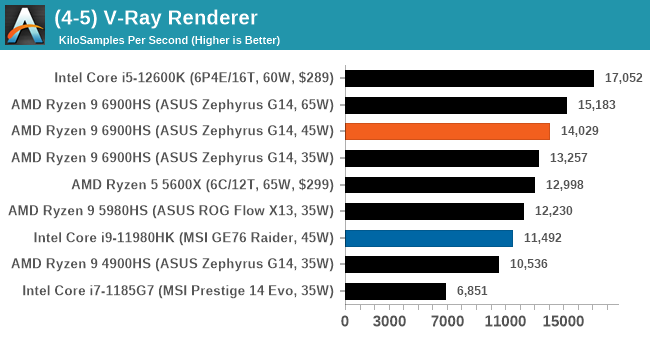
V-Ray: Link
We have a couple of renderers and ray tracers in our suite already, however V-Ray’s benchmark came through for a requested benchmark enough for us to roll it into our suite. Built by ChaosGroup, V-Ray is a 3D rendering package compatible with a number of popular commercial imaging applications, such as 3ds Max, Maya, Undreal, Cinema 4D, and Blender.
We run the standard standalone benchmark application, but in an automated fashion to pull out the result in the form of kilosamples/second. We run the test six times and take an average of the valid results.
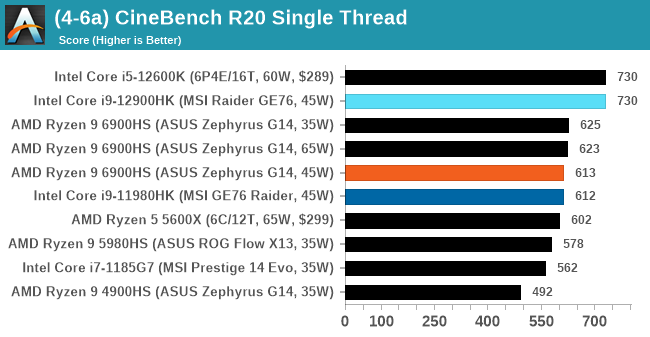
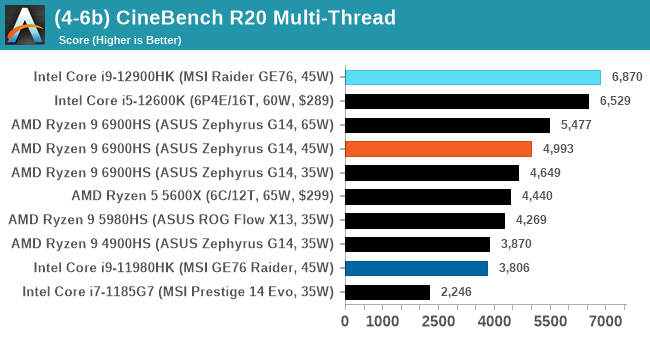
Cinebench R20: Link
Another common stable of a benchmark suite is Cinebench. Based on Cinema4D, Cinebench is a purpose built benchmark machine that renders a scene with both single and multi-threaded options. The scene is identical in both cases. The R20 version means that it targets Cinema 4D R20, a slightly older version of the software which is currently on version R21. Cinebench R20 was launched given that the R15 version had been out a long time, and despite the difference between the benchmark and the latest version of the software on which it is based, Cinebench results are often quoted a lot in marketing materials.
Results for Cinebench R20 are not comparable to R15 or older, because both the scene being used is different, but also the updates in the code bath. The results are output as a score from the software, which is directly proportional to the time taken. Using the benchmark flags for single CPU and multi-CPU workloads, we run the software from the command line which opens the test, runs it, and dumps the result into the console which is redirected to a text file. The test is repeated for a minimum of 10 minutes for both ST and MT, and then the runs averaged.


92 Comments
View All Comments
yankeeDDL - Tuesday, March 1, 2022 - link
Great article, as usual.It seems clear that Intel's AL still has the performance advantage, however, in the Conclusion page, the performance comparison is reference to the nominal consumption (35W, 45W, 65W), while we know that Intel's part can reach twice as much power, in practice, making an apples-to-apples comparison quite difficult, especially in light of Intel's better scaling with more Power.
Is there a way to check the exact performance per core under the same exact consumption (or scaled)?
I am especially interested as a user of the 1165G, which is an absolute battery eater (and/or heater): it seems that AL is a huge improvement, but if it also draws 100W (instead of 45W) to beat Ryzen by a 10%, then it's not worth it. In my opinion.
Spunjji - Tuesday, March 1, 2022 - link
Yes, the overall picture that has built up is of Intel's Alder Lake winning out at higher power levels (40W+) while AMD coming out ahead below that.This is good, because it means that we have great options for people who want the best possible performance in a mobile form-factor and for people who want a more even balance of performance and power usage. It's a nicer situation to be in than when Intel complete owned the mobile segment, followed by the years of stagnation at 14nm.
yankeeDDL - Tuesday, March 1, 2022 - link
Agree on all points.Intel's Tiger Lake is an absolute disaster, and it is actually surprising that Intel only managed to lose 50% market share with such a lousy product compared to Ryzen.
And equally surprising is the insane jump in performance and perf/watt achieved with AL. Definitely good for the consumers.
mode_13h - Tuesday, March 1, 2022 - link
> Intel's Tiger Lake is an absolute disasterThat seems like an overstatement. It just didn't improve enough against Ryzen, particularly in light of the 5000-series' gains. However, especially in light of Ice Lake's disappointments, Tiger Lake didn't seem so bad.
Alistair - Tuesday, March 1, 2022 - link
Tiger Lake was a stroke of luck for Intel, their worst product ever during a massive silicon shortage. They spent the year selling quad cores because AMD was selling everything they could make, not because Tiger Lake was any good.bigboxes - Wednesday, March 2, 2022 - link
For sure. I went with AMD for the first time since 2006 this last year.Samus - Thursday, March 3, 2022 - link
The irony here is AMD mobile CPU's are widespread in lots of desktops and AIO's, even high end units. You would rarely, if ever, see Intel U-series parts in desktops\AIO's outside of USFF's or low-end AIO's with Celeron\Pentiums.This is happening partially because AMD doesn't have a wide product stack like Intel. And they don't need too. The AMD U-series parts are absolute performance monsters and have been for the last 3 generations.
abufrejoval - Friday, March 4, 2022 - link
I own both, a Ryzen 5800U in a notebook and an i7-1165G7 as a NUC.They are really quite comparable, both in iGPU performance, in scalar CPU power and even in multi-threaded CPU power.
At 15 Watts the 8 Ryzen cores operate below the CMOS knee, which means they have to clock so low they can't really gain much against 4 Tiger Lake cores clocking above it. Synthetic benchmarks may prove a lead that's next to impossible to realize or really relevant in day-to-day work. For the heavy lifting, I use a 5950X, which isn't that much faster on scalar loads, but runs almost as many rings around the 5800U as the i7-1165G7: the extra Watts make more of a difference than the cores alone.
My impression is that the Ryzen needs the higher power envelope, 35 or even 65 Watts, and of course a matching workload to put those extra cores to work. AMD's primary aim for their APUs was to cover as many use cases as possible from a single part and they do amazingly well. If they could afford to do a native 4 core variant as well, I'm pretty sure that would outsell the 8 core.
In fact the SteamDeck SoC would probably make a better notebook part for many (not everyone).
And there is nothing wrong with Tiger Lake, except that perhaps today there are better SoCs around: it was and remains a welcome improvement over the previous generations from Intel.
Buy it used and/or cheaper than these AL parts and you should have little to complain about... unless complaining is what you really enjoy.
mode_13h - Tuesday, March 1, 2022 - link
> Great article, as usual.I thought so, as well, which was a relief. Then, I noticed the by-line:
"by Dr. Ian Cutress"
lemurbutton - Tuesday, March 1, 2022 - link
People shouldn't care that much about AMD and Intel on laptops right now. M1 series completely destroys both. AMD and Intel are 3-4 years behind.